Fig. 3
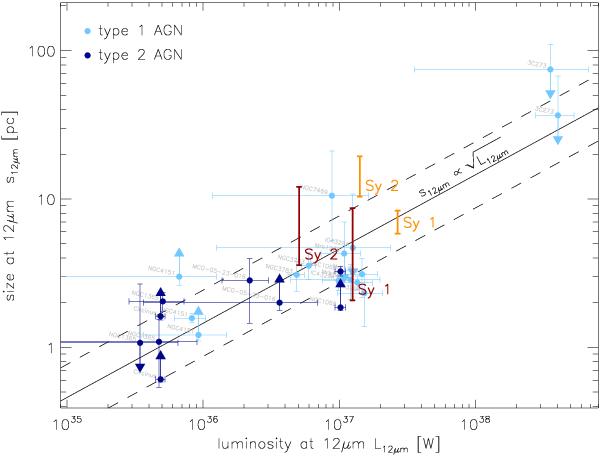
Size of the mid-infrared emitter as a function of its monochromatic luminosity in the mid-infrared for type 1 (light blue) and type 2 (dark blue) AGN. Upper and lower limits on the size estimates are marked by arrows. The fitted relation s = p·L0.5 is delineated by the black continuous line, the scatter in the relation by the dashed lines. The ranges of sizes estimated from the hydrodynamical torus model are plotted in orange, those from the clumpy torus model in dark red.
Current usage metrics show cumulative count of Article Views (full-text article views including HTML views, PDF and ePub downloads, according to the available data) and Abstracts Views on Vision4Press platform.
Data correspond to usage on the plateform after 2015. The current usage metrics is available 48-96 hours after online publication and is updated daily on week days.
Initial download of the metrics may take a while.