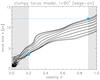
Fig. 2
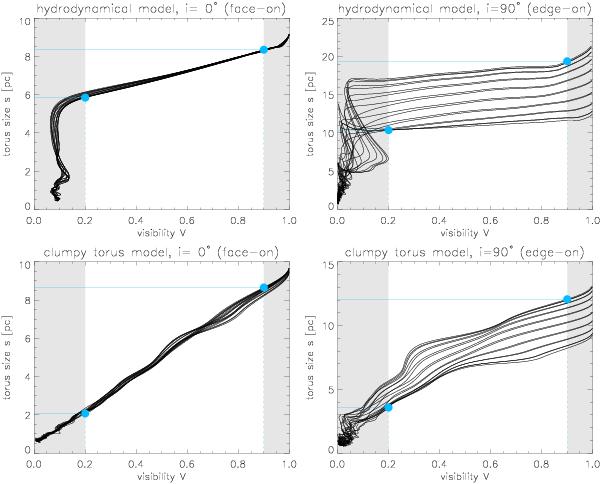
Estimated physical torus size as a function of the visibility at 12 μm for the two torus models. Top row: full hydrodynamical torus model (Sect. 3.1); bottom row: clumpy torus model (Sect. 3.2); left panels: Seyfert 1 (i = 0°) case; right panels: Seyfert 2 (i = 90°) case. Different lines in the plots correspond to baseline orientations at different position angles. The maximum range of sizes defined by the interval 0.2 < V < 0.9 is marked by the blue lines and dots. The excluded visibilities are shaded in grey.
Current usage metrics show cumulative count of Article Views (full-text article views including HTML views, PDF and ePub downloads, according to the available data) and Abstracts Views on Vision4Press platform.
Data correspond to usage on the plateform after 2015. The current usage metrics is available 48-96 hours after online publication and is updated daily on week days.
Initial download of the metrics may take a while.