| Issue |
A&A
Volume 531, July 2011
|
|
|---|---|---|
| Article Number | A49 | |
| Number of page(s) | 10 | |
| Section | Stellar structure and evolution | |
| DOI | https://doi.org/10.1051/0004-6361/201116610 | |
| Published online | 09 June 2011 | |
V2368 Ophiuchi: an eclipsing and double-lined spectroscopic binary used as a photometric comparison star for U Ophiuchi⋆,⋆⋆,⋆⋆⋆
1 Astronomical Institute of the Charles University, Faculty of Mathematics and Physics, V Holešovičkách 2, 180 00 Praha 8, Czech Republic
e-mail: Petr.Harmanec@mff.cuni.cz
2
Hvar Observatory, Faculty of Geodesy, University of Zagreb, 10000 Zagreb, Croatia
3
Departamento de Astronomia, Universidad de Guanajuato, Apartado 144, 36000 Guanajuato, GTO, Mexico
4
Physics & Astronomy Department, University of Victoria, PO Box 3055 STN CSC, Victoria, BC, V8W 3P6, Canada
5
Astronomical Institute, Academy of Sciences of the Czech Republic, 251 65 Ondřejov, Czech Republic
6
Department of Astronomy and Space Sciences, Faculty of Sciences, Erciyes University, 38039 Kayseri, Turkey
Received: 31 January 2011
Accepted: 18 April 2011
The A-type star HR 6412 = V2368 Oph was used by several investigators as a photometric comparison star for the known eclipsing binary U Oph but was found to be variable by three independent groups, including us. By analysing series of new spectral and photometric observations and a critical compilation of available radial velocities, we were able to find the correct period of light and radial-velocity variations and demonstrate that the object is an eclipsing and double-lined spectroscopic binary moving in a highly eccentric orbit. We derived a linear ephemeris Tmin.I = HJD (2 454 294.67 ± 0.01) + (3832712 ± 0 00004) × E and estimated preliminary basic physical properties of the binary. The dereddened UBV magnitudes and effective temperatures of the primary and secondary, based on our light- and velocity-curve solutions, led to distance estimates that agree with the Hipparcos distance within the errors. We find that the mass ratio must be close to one, but the limited number and wavelength range of our current spectra does not allow a truly precise determination of the binary masses. Nevertheless, our results show convincingly that both binary components are evolved away from the main sequence, which makes this system astrophysically very important. There are only a few similarly evolved A-type stars among known eclipsing binaries. Future systematic observations and careful analyses can provide very stringent tests for the stellar evolutionary theory.
Key words: stars: early-type / binaries: close / stars: individual: V2368 Oph / stars: individual: U Oph / binaries: spectroscopic
Based on new spectral and photometric observations from the following observatories: Dominion Astrophysical Observatory, Hvar, Ondřejov, San Pedro Mártir, Tubitak National Observatory, and ASAS service.
Appendices are available in electronic form at http://www.aanda.org
Tables 2–4 are only available at the CDS via anonymous ftp to cdsarc.u-strasbg.fr (130.79.128.5) or via http://cdsarc.u-strasbg.fr/viz-bin/qcat?J/A+A/531/A49
© ESO, 2011
1. Introduction
HR 6412 = HD 156208 has often been used as the photometric comparison star for a well-known eclipsing binary U Oph, which exhibits apsidal motion (Huffer & Kopal 1951; Koch & Koegler 1977; Wolf et al. 2002; Vaz et al. 2007). McAlister et al. (1987) reported that HR 6412 is a speckle-interferometric binary with a separation of 0 136 and estimated the orbital period to 72 years. However, McAlister et al. (1993) could not resolve this pair and concluded that the original detection had been spurious.
In Table 1, we summarize the various determinations of the yellow magnitude of V2368 Oph published by several authors. It seems to indicate that no secular variations in its brightness have been recorded, since the scatter of values of a few hundredths of a magnitude is quite normal for yellow magnitudes recorded in different photometric systems.
During our 2001 observations of U Oph at San Pedro Mártir Observatory (SPM hereafter), HR 6412 was also used as the comparison star. We noticed large changes in this comparison on JD 2 452 071.71–1.85. Upon a literature search, we found that the variability of HR 6412 has been discovered by Perryman & ESA (1997), who classified it as an eclipsing binary with a period of 770. Kazarovets et al. (1999) then assigned it the variable-star name V2368 Oph. The variability has also been confirmed by Vaz et al. (2007), who mention that the period found by Perryman & ESA (1997) was incorrect but give no other details.
Published yellow magnitudes of V2368 Oph.
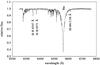 |
Fig. 1 One complete Ondřejov red spectrum of V2368 Oph, taken on HJD 2454357.2917, which shows that the only stronger lines, suitable for the RV measurements, are Hα and the SiII 6347 and 6371 Å. The spectrum contains many water vapour and oxygen telluric lines and the interstellar line at 6613.56 Å. |
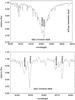 |
Fig. 2 The Hα and SiII 6347 and 6371 Å line profiles from the Ondřejov spectrum taken near one periastron passage on HJD 2 454 636.4608. One can clearly see the lines of both binary components, separated by more than 200 km s-1 in their radial velocity. |
The main goal of this study is to publish the first correct and accurate linear ephemeris of V2368 Oph, which can be used to correct earlier photometric observations of U Oph. We also derive preliminary orbital and light-curve solutions and show that they can lead to self-consistent basic physical properties of the binary. However, considering the limited amount and heterogeneity of our observational material, we do not aim to determine the final, accurate physical elements of the system.
2. Observational material used
2.1. Photometry
After realising that V2368 Oph is a variable star, we started systematic UBV observations of it at Hvar and SPM observatories. A limited set of UBV observations was also obtained by HA at the Turkish National Observatory. Besides, we compiled the Hipparcos Hp observations and V photometry from the ASAS project (Pojmanski 2002). Details on data sets and their reduction are in Appendix A, and all individual UBV and V observations with their HJDs are provided in Table 2 (available at the CDS).
2.2. Spectroscopy
Simultaneously with photometric observations, we also begun to collect electronic spectra in Ondřejov, San Pedro Mártir, and Dominion Astrophysical Observatory (OND, SPM, and DAO hereafter). A detailed discussion of all spectra, their reduction, and a journal of observations can be found in Appendix B.
Here, we only want to add a few comments relevant to further analyses. The only spectral region that is available in the spectra from all three observatories is the red region containing only three strong enough spectral lines suitable for the RV measurements: the Balmer Hα line and the doublet of SiII 6347 and 6371 Å lines (see Figs. 1 and 2). The SPM spectra also cover the region of MgII 4481 Å line, in which both components are clearly seen, so this line was also found suitable for the RV measurements. The RV measurements were carried out in three different ways. (1) We used the program SPEFO (Horn et al. 1996; Škoda 1996), which permits the RV measurements via sliding direct and flipped line profiles on the computer screen until a perfect match is obtained. (2) We fitted the observed line profiles by two Gaussians shifted in their positions in such a way as to obtain the best match of the observed, often blended line profiles of the primary and secondary. (3) We verified our RV values by an automated fitting of a combination of two synthetic spectra – selected from the Ondřejov library of synthetic spectra, prepared and freely distributed by Dr. J. Kubát – to each of the observed spectra using a simplex algorithm. The χ2 (defined in Brož et al. 2010) was calculated for the entire red spectrum in the wavelength range 6256to6768 Å, which includes all the individual lines analysed previously.
The second method is preferred as it returns the most likely velocity amplitudes. The results of the third method are statistically compatible. The first method (SPEFO RV measurements) usually underestimates the true semi-amplitudes of the orbital motion, because of the line blending, especially for the steep wings of Hα. We, therefore, used the SPEFO Hα RVs only for the initial search of the orbital period, to combine them with older published RVs, measured in a standard way from the photographic spectra.
For all red spectra, we followed the procedure outlined in Horn et al. (1996) and measured RVs of a selection of unblended telluric lines in SPEFO. We then used the difference between the calculated heliocentric RV correction and the true mean RV of telluric lines to correct the zero point of the RV scale individually for each spectrogram. Regrettably, these corrections were less reliable for the majority of the red SPM spectra, which only contain very weak telluric lines owing to the high altitude of that observatory. No such corrections were possible for the blue SPM spectra in the absence of telluric lines, of course.
Individual Hα, SiII, and MgII RVs, measured in a standard way in SPEFO and via Gaussian fits to line profiles with their HJDs of mid-exposures are in Table 3 (available at the CDS). The rectified and wavelength-calibrated spectra are in Table 4 (available at the CDS).
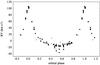 |
Fig. 3 The radial-velocity curve of the primary component of V2368 Oph based on Hα RVs measured in SPEFO for our OND, DAO, and SPM spectra (filled circles) and published RVs (open circles) for the period of 383307 from the FOTEL orbital solution with phase zero at periastron passage. See the text for details. |
3. Preliminary analysis and search for a correct orbital period
As our observations progressed, it soon became obvious that the orbital period must be much longer than the 770 period reported by Perryman & ESA (1997) and that the orbit had to have a high eccentricity, since we were observing a constant brightness and only small RV changes. When we finally succeeded in observing a decline into the minimum on the night JD 2 454 294.35-4.54, we were able to combine it with earlier minima recorded by Hipparcos, ASAS, and our discovery observation at SPM and to obtain the first guess that the period should be close to 38 days. Continuing spectroscopic observations then allowed us to cover parts of two periastron passages on JD 2 454 366-67, and JD 2 454 636 and an iterative analyses of the RV and light curves allowed us to estimate the value of the orbital period to 3833.
There are two limited sets of earlier RV measurements. Christie (1925) published five RVs covering the interval JD 2 423 233.8–995.8, and Palmer et al. (1968) published another five RVs from low-dispersion spectra covering JD 2 437 441.6-740.7. We combined these RVs with our own RV measurements in the program SPEFO (Horn et al. 1996; Škoda 1996) for the Hα line and used the FOTEL program (Hadrava 1990, 2004a) to derive preliminary orbital elements and a more accurate value of the period. We obtained P = 383302 ± 00015, Tperiast. = HJD 54 290.894 ± 0.096, Tmin I = HJD 54 294.417, e = 0.551 ± 0.010, ω = 355.2 ± 1.6, K1 = 59.71 ± 4.1 km s-1, γold = 17.0 ± 3.4, and γnew = 10.07 ± 0.50, the rms errors of the model fit to the data per 1 observation being 10.3, and 4.1 km s-1 for the old and new RVs.
Published uvby and Hβ observations of V2368 Oph.
The final combined light-curve and RV-curve solutions obtained with PHOEBE.
Since the narrow and steep photometric eclipses are very sensitive to the phase shifts, we used an interactive computer program (written by HB), which allows the user to display the phase diagrams based on the observed data in the neighbourhood of the eclipses for various smoothly varied values of the orbital period. This way we found that the true orbital period must be very close to the value of 383272.
4. Towards basic physical properties of the binary
To obtain self-consistent physical properties of the components and the binary system, we had to proceed in an iterative way. We selected several stronger lines seen in both binary components and derived their RVs via Gaussian fits to line profiles. In particular, we used the SiII 6347&6371 Å and Hα lines, available in all spectra, and MgII 4481 Å, measurable in the SPM spectra. For Hα, the Gaussian profiles were not optimal so we tentatively disentangled the Hα profiles, using the KOREL program (Hadrava 1995, 1997, 2004b, 2005) and used the disentangled profiles instead of Gaussians1.
We alternatively used the programs PHOEBE (Prša & Zwitter 2005, 2006) based on the Wilson & Devinney (1971) program, and FOTEL, already used in the first step, to derive preliminary values of some critical parameters. To obtain the best possible estimate of the RV semi-amplitudes, we allowed for individual systemic velocities for each of the ions used. In particular, we found the systemic velocities of 2.97 ± 0.55, 0.14 ± 0.54, and 9.9 ± 6.0 for SiII, MgII, and Hα, respectively. The differences between these values are probably insignificant considering their errors and the inability to check the zero point of the RV scale for the blue spectra via measurements of the telluric lines. Since PHOEBE can treat only one joint systemic velocity, we subtracted the values of respective systemic velocities from the observed RVs and used these shifted RVs from all three ions as one dataset for the primary and another one for the secondary in PHOEBE. We then naturally kept the systemic velocity fixed at zero in PHOEBE solutions.
In the latest (development) version of PHOEBE that we are using, the convergence is governed by minimization of a cost function χ2 defined in the case of our datasets as 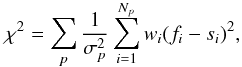 (1)where index p denotes the individual photometric passbands, σp their standard deviations per 1 observation, Np is the number of individual observations for pth passband, wi are standard weights of individual observations, and fi and si the observed and calculated fluxes, respectively. The value of the χ2 function is tabulated along with the solutions.
Although it should be possible to derive the effective temperatures of both binary components from calibrated UBV photometry (Prša & Zwitter 2006; Wilson 2008), the propagation of errors often leads to unreliable results. For that reason we restricted ourselves to the standard approach of estimating the effective temperature of the primary from the dereddened colours and observed spectra, then keeping its value fixed in the solutions.
There are four sets of uvby observations and three sets of Hβ photometry of V2368 Oph – see Table 5. Using the program UVBYBETA written by T. T. Moon and modified by R. Napiwotzki, which is based on a calibration devised by Moon & Dworetsky (1985), we found that those sets of Strömgren photometry imply a mean effective temperature of the binary between 8900 K, and 9400 K and a mean log g between 3.50 and 3.61.
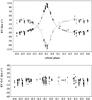 |
Fig. 4 The final radial-velocity curves of both binary components of V2368 Oph based on Gaussian fits (circles) and the theoretical RV curves based on our PHOEBE solution (lines). The lower panel shows the residua from the solution. Typical observational uncertainties are 10 km s-1. Orbital phases from ephemeris (2) are used. |
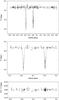 |
Fig. 5 The observed V-band light curve compared to the theoretical one, based on our PHOEBE solution. The lower panels show a zoom of the curves in the neighbourhood of both binary eclipses and the residua from the model fit. Typical 1-σ observational uncertainties are 0ṃ01. Orbital phases from ephemeris (2) are used. |
Since both stars are detached well even near periastron, the light-curve solution basically does not depend on the exact value of the mass ratio. Considering this, a preliminary PHOEBE solution was used to derive relative luminosities of both components, UBV magnitudes of the binary at maximum light from the UBV observations transformed to the standard system and from them the UBV magnitudes of the primary and secondary in each passband. These were then dereddened in a standard way, assuming AV = 3.2 E(). The dereddened magnitudes and indices confirmed the spectral type of A2 for the primary. Using Flower (1996) calibration of ()0 indices vs. bolometric corrections and Teff, we estimated the effective temperature of the primary to (9300 ± 200) K. Keeping the value of 9300 K fixed, we derived a freely converged PHOEBE solution, which is presented in detail in Table 6. The rms errors of all converged parameters in PHOEBE are derived from a covariance matrix. For other, deduced parameters, we propagated the errors to obtain the estimates given in the Table. Since a realistic error of the effective temperature of the primary is about ± 200 K, this must imply that the formal error of the effective temperature of the secondary, estimated from a covariance matrix in PHOEBE, is too low and must also be about ± 200 K.
It is clear at first sight that this solution is not satisfactory since it leads to a model in which the more massive component is the less evolved of the two. We believe that the problem lies in the limited quality of our radial velocities. As a matter of fact, the solutions for RVs of individual ions oscillated between 0.95 and 1.05 in the resulting mass ratio. At the same time, since both binary components are well detached, the light curve solution is stable and basically does not depend on the mass ratio. Therefore, we derived another PHOEBE solution, this time with the mass ratio fixed to 1.0. This solution is also provided in the last three columns of Table 6 and we take it as the reference solution for the following discussion. The corresponding RV curves and the light curve in the V band are shown in Figs. 4, and 5, respectively. It is seen that there is little difference in all parameters, which do not depend on the mass ratio between the two solutions. For completeness, we also derived another solution for the mass ratio of 0.95. This led to a slightly worse χ2 = 1770, but the photometric elements were again very similar to those two shown in Table 6.
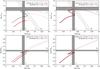 |
Fig. 6 Left panels: a Hertzsprung-Russel diagram (top), and the Teff vs. radius diagram (bottom) showing the stellar evolution of the primary and secondary components of V2368 Oph. It was computed with the MESAstar module, for the masses M1 = 2.62 M⊙, M2 = 2.74 M⊙ and for the metallicity Z = 0.02. The evolutionary tracks are plotted by thick lines from ZAMS up to the age 3.877 × 10⁸ y. The ranges in temperatures T1, T2, luminosities L1, L2 and radii R1, R2 inferred from photometry/spectroscopy are denoted by lines (refer to Table 6). There is a strong disagreement between the observations and the stellar evolution, especially for the primary. Right panel: same for the masses M1 = 2.682 M⊙, M2 = 2.678 M⊙ (i.e., the mass ratio very close to one), and a different value of the metallicity Z = 0.014. The thick lines are terminated at the age 3.938 × 10⁸ y. |
The solutions led to the following linear ephemeris, which should enable correction of existing photometric observations of U Oph secured differentially relative to V2368 Oph:  (2)It is encouraging to note that a separate dereddening of the UBV magnitudes of the primary and secondary led invariably to and to distance moduli of 6.46(12), and 6.47(12) for the primary and secondary, respectively. The dereddened values of the secondary indicate a slightly earlier spectral type, in accordance with its higher effective temperature obtained from the PHOEBE solution. We note that E(b − y) derived with the program UVBYBETA from the uvby values of Table 5 is 0ṃ15, which agrees well with the derived by us2.
The parallax of V2368 Oph was obtained by the ESA Hipparcos mission, and its originally published value (Perryman & ESA 1997) is 000554 ± 000086, while an improved value obtained by van Leeuwen (2007a,b) reads as 000455 ± 000048. The distance modulus obtained from our photometric solution implies a parallax of 000506, in excellent agreement with the above values, deduced from the Hipparcos observations.
5. Stellar evolution of the components
Since V2368 Oph is a detached binary with no evidence of mass transfer, one can use a one-dimensional program for stellar evolution to see whether the observed properties of the binary agree with the model prediction. To this end, we used the stellar-evolution module MESAstar by Paxton et al. (2011).
We first calculated the model evolution for the masses M1 = 2.62 M⊙ and M2 = 2.74 M⊙ which follow from the free PHOEBE solution with the lowest χ2 for the combined photometric and RV data (Table 6, left). We assumed the same metallicities of Z = 0.02 for both components, of course, the helium abundance Y = 0.28 and the mixing-length parameter α = 2.0. The result is compared to the observed binary properties in the Hertzsprung–Russell diagram, and the Teff vs. radius diagram (Fig. 6, left panels). Even though there are uncertainties in temperatures, luminosities and masses of the individual components (refer to Table 6), their differences are established much more accurately; e.g., the difference in temperatures T2 − T1 ≃ 200 K is always present in PHOEBE solutions since this is enforced by the observed light curve and colour indices.
There is a clear disagreement between the photometric/spectroscopic observations and the predicted stellar evolution in this case. Since the mass ratio q = M1/M2 ≐ 0.96 differs significantly from 1, the calculated luminosities of the components are always very different owing to a strong dependence of the stellar evolution on the mass (log L2/L⊙ reaches ≃ 2.0 and log L1/L⊙ ≃ 1.9), while the observed luminosities are rather similar (log L1/L⊙ ≃ log L2/L⊙ ≃ 2.03). A change in neither metallicity nor in the mixing-length parameter could alter this result since a different value of Z would shift both tracks in the same direction, and varying α from 1.5 to 2.5 does not alter evolutionary tracks significantly before the red giant branch is reached.
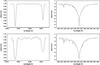 |
Fig. 7 A comparison of disentangled (solid lines) and synthetic (dotted lines) profiles of the SiII line (left panels) and Hα line (right) for the primary (top panels) and secondary components (bottom). See the text for details. |
As a second test, we took the mass ratio q close to 1, which is still compatible with the photometric/spectroscopic observations from a statistical point of view (Table 6, right). Because the stellar evolution is very sensitive to the stellar mass, we may actually use this approach to constrain the mass ratio of V2368 Oph. The most sensitive indicator seems to be the temperature – there is approximately a 200 K difference between T1 and T2, which corresponds to a 0.004 to 0.008 M⊙ difference between M1 and M2, according to our tests. If we use M1 = 2.682 M⊙ and M2 = 2.678 M⊙ we also have to decrease the metallicity to Z = 0.014, which shifts both the evolutionary tracks towards higher T and L, in order to match the observed state of V2368 Oph (Fig. 6, right panels). Another possibility would be to slightly increase the masses to M1 = 2.760 M⊙ and M2 = 2.752 M⊙ and to retain the Z = 0.02 value. To conclude, it is possible to find a consistent solution for the available photometry and spectroscopy and the stellar evolution, even though the parameters presented above cannot be considered as final, because the total mass of the system is not yet constrained precisely enough.
From the standpoint of stellar evolution, V2368 Oph is a very interesting evolved system with both components leaving the main sequence. It is in a rapid phase of evolution and consequently may serve as a very sensitive test case for the stellar-evolution programmes, provided new, accurate RVs and photometric observations are acquired. Considering the relatively short distance of the binary from us, its interferometry would also be of utmost importance, providing the angular separation of the components and orbital inclination, consequently a much more precise parallax and the total mass of the system. Interferometry can also provide independent constraints on the component radii.
6. A comparison with synthetic spectra and the rotation of the binary components
As another consistency check, we disentangled the SiII and Hα line profiles with the help of the KOREL program (Hadrava 1995, 1997, 2004b, 2005), keeping the orbital parameters from the second PHOEBE solution fixed, but using the mass ratio of 0.998 (considering the discussion above). In Fig. 7, the disentangled line profiles, normalized to their individual continua using the relative luminosities derived by PHOEBE, are compared with the synthetic line profiles from the Ondřejov library of synthetic spectra prepared and freely distributed by Dr. J. Kubát – see, e.g. Harmanec et al. (1997a) for details. We used the synthetic spectra for the parameters close to the PHOEBE results, namely Teff = 9500 K and log g = 3.5, rotationally broadened in SPEFO to 40 km s-1 for the primary and to 90 km s-1 for the secondary. Varying these values for more than ± 5 km s-1 would result in a significant disagreement in the depths and widths between the observed and synthetic line profiles.
The agreement between the observed and synthetic spectra is satisfactory, lending some credibility to our result. We warn, however, that the heterogeneity of our material means that there can still be rather large uncertainties in the derived masses, radii, and luminosities. Another study based on rich and homogeneous observational material is therefore desirable.
Taken at face value, the observed projected rotational velocities and the PHOEBE solution would imply the stellar rotational periods of 50 and 22 for the primary and secondary, respectively, while the spin-orbit synchronization in periastron would imply a rotational period of 105. It is notable that in their detailed study of another evolved A-type binary with eccentric orbit, θ2 Tau, Torres et al. (2011) also found the projected rotational velocity for the secondary roughly twice as high as for the primary.
In passing, we wish to mention that it is also possible to make a theoretical prediction of the internal structure constant based on the current evolutionary models of Claret (2004) with the standard chemical composition of (X,Z) = (0.70,0.02): log k2 = −2.498 for both binary components. Taking the values of the eccentricity and fractional radii from Table 6 into account, we can predict a very slow apsidal-motion rate of  deg/cycle, which is only 0.27 deg/century. The relativistic contribution to the apsidal motion is substantial:
  deg/cycle or about 70% of the total apsidal-advance rate (Gimenez 1985). In other words, there is little chance of detecting a measurable apsidal motion for this binary in the foreseeable future.
Online material
Appendix A: Photometry
Journal of available photometry of V2368 Oph.
Here we provide detailed comments on the photometric observations used in this study and the way we treated them.
-
1.
Hvar observations were secured in 2007, 2008, and2009 and reduced and transformed into the standardUBV system with the HEC22 release16.1 reduction program via nonlinear transfor-mation formulæ (Harmanecet al. 1994; Harmanec& Horn 1998). This recent version of the programallows modelling of variable extinction during the observingnight, which significantly improves the accuracy of the obser-vations. The typical rms errors of the multinight fit to all standardstars used to define the transformation formulæ ina given observating season are 0ṃ008 for V and B, and 0ṃ010 for U. This is similar for observations from other observing stations reduced with the help of HEC22.
-
2.
San Pedro Mártir observations were collected during the observational runs in 2001–2003 and 2007. Observations were reduced and transformed into the standard UBV system with the HEC22 release 14.1 reduction program via nonlinear transformation formulæ (Harmanec et al. 1994; Harmanec & Horn 1998). At that station V2368 Oph was used in 2001 as a recommended comparison star for the eclipsing binary U Oph and its magnitude difference relative to several comparison stars (HD 183324, HD 187458, HD 161132, HD 153808, and HD 144206) was derived. For all these stars, save HD 183324, the magnitudes and colours are well established from the calibrated Hvar all-sky photometry. HD 183324 = V1431 Aql was found to be a small-amplitude λ Bootis variable (Kuschnig et al. 1994). It served for a long time as a comparison star for observations of V923 Aql and V1294 Aql in the Photometry of the Bright Northern Be Star Programme (Harmanec et al. 1982, 1994; Pavlovski et al. 1997; Harmanec et al. 1997b) and its variability on longer time scales is safely excluded by numerous Hvar observations. The mean all-sky UBV magnitudes of HD 183324 are accurately derived. It was actually used as a comparison for V2368 Oph only on the night JD 2 452 065, and we feel that its 2 mmag microvariability is not critical for the purpose of this study. For 13 observations secured on JD 2 452 071 (when we recorded the first eclipse of V2368 Oph), it was not possible to derive the differential values for it so we adopted its all-sky values instead, since enough standard stars had been observed during the night, and the nightly transformation coefficients (extinction and its variations and the zero points) could be derived. As soon as we realized that V2368 Oph is a variable, its subsequent observations in 2002 and 2003 were carried out differentially, relative to HD 154660 = HR 6361. This A9V star is a visual binary ADS 10347A with a close companion ADS 10347B at 20
 3, which is some 3ṃ35 fainter than ADS 10347A. The 2007 observations were obtained with a larger diaphragm so that the light of the visual component ADS 10347B was recorded with the brighter component ADS 10347A = HD 6361. We carried out dedicated observations at Hvar to derive the total magnitude of both visual components and added this value to the magnitude differences var – comp. from this season. In all other instances, observations were carried out in such a way as to keep ADS 10347B outside the diaphragm.
 -
3.
Hipparcos all-sky Hp broad-band magnitudes secured between 1989 and 1993 (Perryman & ESA 1997) were transformed to the standard Johnson V magnitude with the nonlinear transformation formula derived by Harmanec (1998). The rms error of the fit per 1 observations is 0ṃ0067. For the solutions, the transmission and the limb darkening coefficients for the Hp passband were considered, however. All data with error flags larger than 1 and one deviating point at HJD 2448661.4682 were omitted.
-
4.
TNO (Tubitak National Observatory) observations were secured during two consecutive nights in 2003 and were reduced and transformed into the standard UBV system with the HEC22 release 14.1 reduction program via nonlinear transformation formulæ (Harmanec et al. 1994; Harmanec & Horn 1998).
-
5.
ASAS V magnitude observations were extracted from the public ASAS database (Pojmanski 2002); we used the data from the diaphragm, which gives the smallest rms errors and omitted a few clearly deviating data points.
The journal of all photometric observations is in Table A.1. Homogenized UBV magnitudes of all comparison and check stars used can be found in Table A.2.
Comparisons and check stars of V2368 Oph.
Appendix B: Spectroscopy
Journal of spectroscopic data of V2368 Oph.
The journal of all spectroscopic observations can be found in Table B.1. The individual data files are identified there by letters. Below, we provide a few comments on them.
-
File A. CCD spectra of V2368 Oph covering the wavelengthregion 6260–6750 Å. They weresecured with a SITe-005 800 × 2000 CCD detector attached to the medium 0.7-m camera of the coudé focus of the Ondřejov 2.0 m telescope (OND). The spectra were obtained between June 2007 and June 2008 and have a linear dispersion of 17.2 Å mm-1 (red) and a 2-pixel resolving power of about 12600 (11 − 12 km s-1 per pixel). Their S/N ranges from 50 (1 spectrum) to 370, and the majority have S/N over 200.
-
File B. CCD spectra covering the wavelength region 6150–6750 Å with a resolution of 6.6 km s-1 per pixel. They were obtained at the DAO 1.22-m telescope between August 2007 and September 2009 and have a reciprocal linear dispersion of 10 Å mm-1. The detector used was a SITe-4 4096 × 2048 CCD, and the 3-pixel resolving power was about 15 000. Their S/N ranges from 100 to 370.
-
File C. CCD echelle spectra secured with the 2.14-m reflector of the SPM observatory in April 2003. The CCD detector has 1024 × 1024 pixels, and the setting used covered the wavelength region from 4000 to 6700 Å in grating orders 33 to 60. The nominal resolution of the spectrograph is 18 000 at 5000 Å, which translates into 2-pixel resolution of about 17 km s-1.
-
File D. Another set of echelle CCD spectra from SPM, secured in April 2007.
-
File E. The third set of echelle CCD spectra from SPM, secured from May 30 to June 1, 2007. The S/N of the SPM spectra ranges between 120 and 500 for the red, and 85 to 230 for the blue parts of the spectra.
The initial reductions of the DAO spectra (bias subtraction, flatfielding and conversion to 1-D images) were carried out by SY in IRAF. The initial reduction of the SPM and OND spectra was carried out by PE and by Dr. M. Šlechta, respectively, including the wavelength calibration. The remaining reductions of all spectra (including wavelength calibration for the DAO spectra, continuum rectification, and removal of cosmics and flaws) was carried out with the program SPEFO (Horn et al. 1996; Škoda 1996).
Acknowledgments
We acknowledge the use of the latest version of the PHOEBE program, developed and freely distributed by Dr. A. Prša; of the latest publicly available versions of programs FOTEL and KOREL written and distributed by Dr. P. Hadrava; of the freely distributed MESAstar module for stellar evolution by Dr. B. Paxton and collaborators; and of the program UVBYBETA written by Dr. T. T. Moon and modified by Dr. R. Napiwotzki. We also profited from the use of the library of synthetic spectra prepared and provided by Dr. J. Kubát. The constructive criticism of an anonymous referee helped us improve the presentation of the results. The research of the Czech authors was supported by the grants 205/06/0304, 205/08/H005, and P209/10/0715 of the Czech Science Foundation and also from the Research Program MSM0021620860 Physical study of objects and processes in the solar system and in astrophysics of the Ministry of Education of the Czech Republic. We acknowledge the use of the electronic database from the CDS Strasbourg and the electronic bibliography maintained by the NASA/ADS system.
References
- Becker, G. A., Chambliss, C. R., & Kiasat, A. 1975, Inf. Bull. Var. Stars, 1067, 1 [NASA ADS] [Google Scholar]
- Brož, M., Mayer, P., Pribulla, T., et al. 2010, AJ, 139, 2258 [NASA ADS] [CrossRef] [Google Scholar]
- Christie, W. H. 1925, Publ. Dominion Astrophys. Obs. Victoria, 3, 209 [NASA ADS] [Google Scholar]
- Claret, A. 2004, A&A, 424, 919 [NASA ADS] [CrossRef] [EDP Sciences] [Google Scholar]
- Crawford, D. L., Barnes, J. V., Gibson, J., et al. 1972, A&AS, 5, 109 [Google Scholar]
- Eggen, O. J. 1955, AJ, 60, 65 [NASA ADS] [CrossRef] [Google Scholar]
- Flower, P. J. 1996, ApJ, 469, 355 [NASA ADS] [CrossRef] [Google Scholar]
- Gimenez, A. 1985, ApJ, 297, 405 [NASA ADS] [CrossRef] [Google Scholar]
- Grønbech, B., & Olsen, E. H. 1976, A&AS, 25, 213 [NASA ADS] [Google Scholar]
- Gronbech, B., Gyldenkerne, K., & Jorgensen, H. E. 1977, A&A, 55, 401 [NASA ADS] [Google Scholar]
- Hadrava, P. 1990, Contr. Astron. Obs. Skalnaté Pleso, 20, 23 [Google Scholar]
- Hadrava, P. 1995, A&AS, 114, 393 [NASA ADS] [Google Scholar]
- Hadrava, P. 1997, A&AS, 122, 581 [NASA ADS] [CrossRef] [EDP Sciences] [Google Scholar]
- Hadrava, P. 2004a, Publ. Astron. Inst. Acad. Sci. Czech Rep., 92, 1 [Google Scholar]
- Hadrava, P. 2004b, Publ. Astron. Inst. Acad. Sci. Czech Rep., 92, 15 [Google Scholar]
- Hadrava, P. 2005, Ap&SS, 296, 239 [NASA ADS] [CrossRef] [Google Scholar]
- Harmanec, P. 1998, A&A, 334, 558 [NASA ADS] [Google Scholar]
- Harmanec, P., & Horn, J. 1998, J. Astron. Data, 4, 5 [Google Scholar]
- Harmanec, P., Horn, J., & Koubský, P. 1982, in Be Stars, ed. M. Jaschek, & H.-G. Groth, IAU Symp., 98, 269 [Google Scholar]
- Harmanec, P., Horn, J., & Juza, K. 1994, A&AS, 104, 121 [NASA ADS] [Google Scholar]
- Harmanec, P., Hadrava, P., Yang, S., et al. 1997a, A&A, 319, 867 [NASA ADS] [Google Scholar]
- Harmanec, P., Pavlovski, K., Božić, H., et al. 1997b, J. Astron. Data, 3, 5 [Google Scholar]
- Horn, J., Kubát, J., Harmanec, P., et al. 1996, A&A, 309, 521 [NASA ADS] [Google Scholar]
- Huffer, C. M., & Kopal, Z. 1951, ApJ, 114, 297 [NASA ADS] [CrossRef] [Google Scholar]
- Kazarovets, A. V., Samus, N. N., Durlevich, O. V., et al. 1999, Inf. Bull. Var. Stars, 4659, 1 [Google Scholar]
- Koch, R. H., & Koegler, C. A. 1977, ApJ, 214, 423 [NASA ADS] [CrossRef] [Google Scholar]
- Kuschnig, R., Paunzen, E., & Weiss, W. W. 1994, Inf. Bull. Var. Stars, 4070, 1 [NASA ADS] [Google Scholar]
- McAlister, H. A., Hartkopf, W. I., Hutter, D. J., Shara, M. M., & Franz, O. G. 1987, AJ, 93, 183 [NASA ADS] [CrossRef] [Google Scholar]
- McAlister, H. A., Mason, B. D., Hartkopf, W. I., & Shara, M. 1993, AJ, 106, 1639 [NASA ADS] [CrossRef] [Google Scholar]
- Moon, T. T., & Dworetsky, M. M. 1985, MNRAS, 217, 305 [NASA ADS] [CrossRef] [Google Scholar]
- Palmer, D. R., Walker, E. N., Jones, D. H. P., & Wallis, R. E. 1968, Roy. Obs. Bull., 135, 385 [NASA ADS] [Google Scholar]
- Pavlovski, K., Harmanec, P., Božić, H., et al. 1997, A&AS, 125, 75 [NASA ADS] [CrossRef] [EDP Sciences] [Google Scholar]
- Paxton, B., Bildsten, L., Dotter, A., et al. 2011, ApJS, 192, 3 [Google Scholar]
- Perryman, M. A. C., & ESA 1997, The HIPPARCOS and TYCHO catalogues, Astrometric and photometric star catalogues derived from the ESA Hipparcos Space Astrometry Mission (Noordwijk, Netherlands: ESA Publications Division), ESA SP Ser., 1200 [Google Scholar]
- Pojmanski, G. 2002, Acta Astron., 52, 397 [NASA ADS] [Google Scholar]
- Prša, A., & Zwitter, T. 2005, ApJ, 628, 426 [NASA ADS] [CrossRef] [Google Scholar]
- Prša, A., & Zwitter, T. 2006, Ap&SS, 304, 347 [NASA ADS] [CrossRef] [Google Scholar]
- Škoda, P. 1996, in Astron. Data Anal. Soft. Syst. V, ASP Conf. Ser., 101, 187 [Google Scholar]
- Sowell, J. R., & Wilson, J. W. 1993, PASP, 105, 36 [NASA ADS] [CrossRef] [Google Scholar]
- Stokes, N. R. 1972, MNRAS, 160, 155 [NASA ADS] [Google Scholar]
- Torres, K. B. V., Lampens, P., Frémat, Y., et al. 2011, A&A, 525, A50 [NASA ADS] [CrossRef] [EDP Sciences] [Google Scholar]
- van Gent, R. H. 1982, Inf. Bull. Var. Stars, 2140, 1 [NASA ADS] [Google Scholar]
- van Leeuwen, F. 2007a, in Astrophys. Space Sci. Lib. 350, ed. F. van Leeuwen, (Germany: Springer) [Google Scholar]
- van Leeuwen, F. 2007b, A&A, 474, 653 [NASA ADS] [CrossRef] [EDP Sciences] [Google Scholar]
- Vaz, L. P. R., Andersen, J., & Claret, A. 2007, A&A, 469, 285 [NASA ADS] [CrossRef] [EDP Sciences] [Google Scholar]
- Wilson, R. E. 2008, ApJ, 672, 575 [NASA ADS] [CrossRef] [Google Scholar]
- Wilson, R. E., & Devinney, E. J. 1971, ApJ, 166, 605 [NASA ADS] [CrossRef] [Google Scholar]
- Wolf, M., Harmanec, P., Diethelm, R., Hornoch, K., & Eenens, P. 2002, A&A, 383, 533 [NASA ADS] [CrossRef] [EDP Sciences] [Google Scholar]
All Tables
All Figures
|
Fig. 1 One complete Ondřejov red spectrum of V2368 Oph, taken on HJD 2454357.2917, which shows that the only stronger lines, suitable for the RV measurements, are Hα and the SiII 6347 and 6371 Å. The spectrum contains many water vapour and oxygen telluric lines and the interstellar line at 6613.56 Å. |
| In the text | |
|
Fig. 2 The Hα and SiII 6347 and 6371 Å line profiles from the Ondřejov spectrum taken near one periastron passage on HJD 2 454 636.4608. One can clearly see the lines of both binary components, separated by more than 200 km s-1 in their radial velocity. |
| In the text | |
|
Fig. 3 The radial-velocity curve of the primary component of V2368 Oph based on Hα RVs measured in SPEFO for our OND, DAO, and SPM spectra (filled circles) and published RVs (open circles) for the period of 383307 from the FOTEL orbital solution with phase zero at periastron passage. See the text for details. |
| In the text | |
|
Fig. 4 The final radial-velocity curves of both binary components of V2368 Oph based on Gaussian fits (circles) and the theoretical RV curves based on our PHOEBE solution (lines). The lower panel shows the residua from the solution. Typical observational uncertainties are 10 km s-1. Orbital phases from ephemeris (2) are used. |
| In the text | |
|
Fig. 5 The observed V-band light curve compared to the theoretical one, based on our PHOEBE solution. The lower panels show a zoom of the curves in the neighbourhood of both binary eclipses and the residua from the model fit. Typical 1-σ observational uncertainties are 0ṃ01. Orbital phases from ephemeris (2) are used. |
| In the text | |
|
Fig. 6 Left panels: a Hertzsprung-Russel diagram (top), and the Teff vs. radius diagram (bottom) showing the stellar evolution of the primary and secondary components of V2368 Oph. It was computed with the MESAstar module, for the masses M1 = 2.62 M⊙, M2 = 2.74 M⊙ and for the metallicity Z = 0.02. The evolutionary tracks are plotted by thick lines from ZAMS up to the age 3.877 × 10⁸ y. The ranges in temperatures T1, T2, luminosities L1, L2 and radii R1, R2 inferred from photometry/spectroscopy are denoted by lines (refer to Table 6). There is a strong disagreement between the observations and the stellar evolution, especially for the primary. Right panel: same for the masses M1 = 2.682 M⊙, M2 = 2.678 M⊙ (i.e., the mass ratio very close to one), and a different value of the metallicity Z = 0.014. The thick lines are terminated at the age 3.938 × 10⁸ y. |
| In the text | |
|
Fig. 7 A comparison of disentangled (solid lines) and synthetic (dotted lines) profiles of the SiII line (left panels) and Hα line (right) for the primary (top panels) and secondary components (bottom). See the text for details. |
| In the text | |
Current usage metrics show cumulative count of Article Views (full-text article views including HTML views, PDF and ePub downloads, according to the available data) and Abstracts Views on Vision4Press platform.
Data correspond to usage on the plateform after 2015. The current usage metrics is available 48-96 hours after online publication and is updated daily on week days.
Initial download of the metrics may take a while.