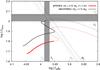
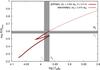
Fig. 6
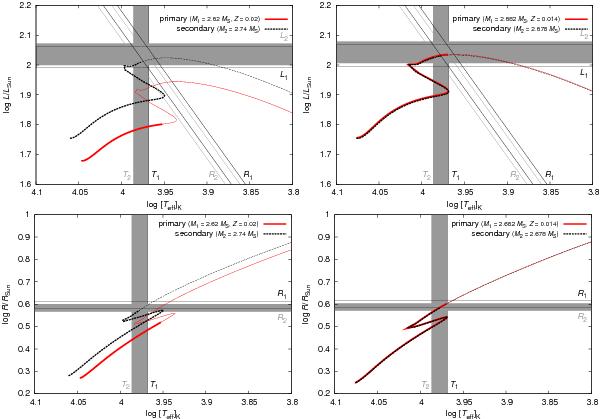
Left panels: a Hertzsprung-Russel diagram (top), and the Teff vs. radius diagram (bottom) showing the stellar evolution of the primary and secondary components of V2368 Oph. It was computed with the MESAstar module, for the masses M1 = 2.62 M⊙, M2 = 2.74 M⊙ and for the metallicity Z = 0.02. The evolutionary tracks are plotted by thick lines from ZAMS up to the age 3.877 × 10⁸ y. The ranges in temperatures T1, T2, luminosities L1, L2 and radii R1, R2 inferred from photometry/spectroscopy are denoted by lines (refer to Table 6). There is a strong disagreement between the observations and the stellar evolution, especially for the primary. Right panel: same for the masses M1 = 2.682 M⊙, M2 = 2.678 M⊙ (i.e., the mass ratio very close to one), and a different value of the metallicity Z = 0.014. The thick lines are terminated at the age 3.938 × 10⁸ y.
Current usage metrics show cumulative count of Article Views (full-text article views including HTML views, PDF and ePub downloads, according to the available data) and Abstracts Views on Vision4Press platform.
Data correspond to usage on the plateform after 2015. The current usage metrics is available 48-96 hours after online publication and is updated daily on week days.
Initial download of the metrics may take a while.