| Issue |
A&A
Volume 531, July 2011
|
|
|---|---|---|
| Article Number | A34 | |
| Number of page(s) | 6 | |
| Section | Stellar structure and evolution | |
| DOI | https://doi.org/10.1051/0004-6361/201016373 | |
| Published online | 07 June 2011 | |
Dissecting the donor star in the eclipsing polar HU Aquarii
1
Leibniz-Institut für Astrophysik Potsdam (AIP),
An der Sternwarte 16,
14482
Potsdam, Germany
e-mail: This email address is being protected from spambots. You need JavaScript enabled to view it.
2
Univ. of St. Andrews, School of Physics and
Astronomy, North Haugh, St.
Andrews, Fife KY16 9SS, Scotland, UK
3
Department of Physics, University of Warwick,
Coventry
CV4 7AL,
UK
4
NASA Ames Research Center, Moffett Field, CA
94035,
USA
5
Bay Area Environmental Research Institute,
560 Third St West, Sonoma, CA
95476,
USA
Received: 20 December 2010
Accepted: 3 April 2011
Abstract
Medium-resolution spectroscopic observations with full phase coverage of the eclipsing
polar HU Aqr are presented. Na i absorption and Ca ii emission lines are
used to trace the secondary star. While the Na i lines seem to have contributions
from both hemispheres of the donor star, the Ca ii lines were found to originate
from the irradiated part of its surface alone. An irradiation model was applied and the
irradiation-weighted radial velocity amplitude was used to determine the mass ratio
Q = MWD/M2 = 4.58 ± 0.20.
When combined with high-speed photometric low-state eclipse light curves, the white dwarf
mass is constrained to
0.75 < MWD/M⊙ < 0.84 with
a best-fit value of
MWD = (0.80 ± 0.04) M⊙, and
M2 = (0.18 ± 0.06) M⊙ at an
orbital inclination of  .
.
Key words: binaries: eclipsing / stars: variables: general
© ESO, 2011
1. Introduction
HU Aquarii is the optical counterpart of the ROSAT All-Sky Survey (RASS) X-ray source RX J2107.9–0518 (Hakala et al. 1993; Schwope et al. 1993). It is a magnetic cataclysmic variable of the AM Herculis type (also termed polars). Owing to its relative high brightness, Vmax < 15, and its deep binary eclipse, ΔV ~ 5, it invited in-depth studies of the accretion process and the stellar components through high-resolution observations, both in time and wavelength, in all relevant spectral regimes from the IR to the X-ray range. In particular, indirect imaging techniques like Doppler tomography, Roche tomography, and eclipse mapping were feasible for the first time in a magnetic CV and revealed deep insight into the geometry and physics of the accretion process (Bridge et al. 2002; Glenn et al. 1994; Harrop-Allin et al. 2001, 1999; Heerlein et al. 1999; Schwope et al. 1997, 2001, 2003; Schwarz et al. 2009; Vrielmann & Schwope 2001; Watson et al. 2003).
HU Aqr was bright during the RASS in 1990 and until 1993, but has been observed in intermediate or low states on most occasions since then. Here we report on spectroscopic observations obtained in an intermediate state of accretion obtained during a coordinated observing campaign involving the ROSAT and EUVE satellite observatories, the HST, the WHT and smaller photometric telescopes. Many observations during that campaign have been published (Schwope et al. 2001; Howell et al. 2002; Schwope 2001; Schwope et al. 2004, 1998; Schwarz et al. 2009), and here we present an update on the binary system parameters.
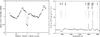 |
Fig. 1 (Left) Light curve of HU Aqr obtained on Sep. 3–4, 1996. The quantity shown is the mean flux density averaged over the given wavelength range, units are 10-16 erg cm-2 s-1 Å-1. (Right) Orbital mean spectrum of HU Aqr after correcting individual spectra to radial velocity zero with a radial velocity semi-amplitude K2 = 280 km s-1. |
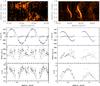 |
Fig. 2 Line profile variations and parameters of the Na i absorption lines (left) and the Ca ii emission lines (right). The top row shows the phase-folded spectra arranged as a trailed spectrogram. The second row shows the measured line parameters. For Na i the same data are shown twice for clarity. Parameters of the Ca ii lines are derived from a combined fit to both lines (left) and from a fit to just the Ca ii 8498 (right). (Top panels) Observed radial velocities and residuals of sine fits. The fits are shown with blue solid lines. Dotted horizontal lines indicate the systemic velocity. (Middle panels) Full width of the lines at half maximum, solid lines indicate predictions of our illumination model for Q = M1/M2 = 4.6. (Bottom panels) Observed and predicted orbital light curves (flux units are 10-16 erg cm-2 s-1 , the model curves were scaled arbitrarily). |
2. Phase-resolved spectroscopy of HU Aqr with the WHT
HU Aqr was observed with the 4.2 m William Herschel Telescope (WHT) at the Observatorio del Roque de los Muchachos on the nights of 1996 Sep. 3 and 4, with the ISIS double-beam spectrograph. Here we analyse data obtained during the first night of the run through the red channel of the spectrograph. Over the second night the red channel was used to observe the Hα line. Its shape and variability resemble that of He ii 4686 obtained on the same occasion (Schwope et al. 2004).
The observations started at UT 23:39 on Sep. 3, and lasted until UT 03:03 on Sep. 4, thus covering 1.64 orbital cycles of the Porb = 125 min binary. Arc lamp spectra were obtained at half-hour intervals. The spectroscopic standard stars BD+28°4211 and Feige 110 were observed through wide and narrow slits for flux calibration and telluric line correction, respectively, before and after observing HU Aqr. Our spectra were calibrated against an absolute flux scale using the response functions from the standard star observations through a wide slit. We estimate that slit losses cause the absolute flux levels to be underestimated by ~30%. Individual exposure times were 2 min. A total of 82 spectra covering the wavelength interval 7824 Å to 8638 Å with a FWHM resolution of ~1.5 Å were obtained. The seeing varied between 0.9″ and 1.5″ leading to variable slit loss at the 1″ slit while the transparency seemed to be stable otherwise.
The mid-exposure times of individual spectra were transformed to binary phases using the epoch of phase zero as determined by Vogel et al. (2008) and the period of Schwope et al. (1997), TT = 2450325.959267 + E × 0.086820446. Vogel et al. (2008) analysed high-speed HST spectrophotometry obtained quasi-simultaneously with the data presented here. The contemporaneous phase zero reference appears superior to us to any timing derived from a long-term ephemeris since the latter shows changes which have not yet been satisfactorily explained (see the discussion in Schwope et al. 2001; Vogel et al. 2008; Schwarz et al. 2009; Nasiroglu et al. 2010; Qian et al. 2011).
2.1. Analysis and results
A light curve derived from our phase-resolved spectra and an orbit-averaged spectrum are shown in Fig. 1. The light curve is very similar to those obtained with CCD cameras throughout the whole campaign (for a collection of light curves see Schwope et al. 2001). The eclipse, however, is shallower comparatively in the WHT data due to contributions from the secondary star. Four of our spectra were obtained while the white dwarf was eclipsed. The declining flux seen during eclipse is due to progressive occultation of the accretion stream and accretion curtain.
The mean spectrum displays as distinct and pronounced features the Na i doublet (8183/8194 Å) in absorption and two lines of the Ca ii triplet at 8498 Å and 8542 Å, respectively, in emission. Several weaker lines including the Paschen lines P11 and P12, and He ii 8236 are present in the spectra but too weak to be analysed individually. P11 and P12 are blended with the Ca ii lines and may bias those results. P13 can barely be recognized and P14 is not detected.
Phase-dependent variability of the Na i and Ca ii lines is illustrated in Fig. 2 (top row) showing phase-binned spectra arranged like a trailed spectrogram with 40 phase bins. The intensity of the Paschen lines decreases with order number, hence Ca ii 8542 suffers stronger blending with P11 than Ca ii 8498 Å does with P12. In Fig. 2 the spectral continua were fitted with low-order polynomials and subtracted so that the eclipse and any continuum variability are removed.
All lines display pronounced orbital variability in their wavelength, their strength and also in their width. We measured the parameters of the Na i absorption lines in the phase-folded spectra by fitting double Gaussians with fixed separation and common widths and fluxes. These constraints were applied to cope with the low signal-to-noise ratio of the spectra. Results for the radial velocity, the FWHM variability and the photometric variability of the Na lines are displayed in Fig. 2 (lower left panels).
Similarly, the Ca ii emission lines were fitted by double Gaussians with fixed separation, identical width and fixed flux ratio of the two lines. Since the Paschen line P12 (blended with Ca ii 8542) is stronger than P13 (blended with Ca ii 8498) and might bias our result, we also fitted single Gaussians just to the less-blended line. The results of all these fits are summarized in Fig. 2 (lower right panels). Results for the combined fit are shown on the left while those for Ca ii 8498 alone are shown on the right. Those latter data are shown without error bars. Their size is comparable to the errors of the combined fit.
The Na I absorption and Ca II emission lines are both tracing the secondary star in terms of the radial velocity curve. Both lines are affected by irradiation of the hemisphere facing the white dwarf star, leading to a reduction of the Na i equivalent width and strong enhancement of Ca ii. At phase φ = 0.5 the Na lines lines cannot be recognized any more and the double-Gaussian fit fails to find significant results. The residuals of a sine fit applied to the radial velocity curve show random scatter only, the parameters of a sine fit v = γ + K sin(2π(φ − φ0)) are given in Table 1.
Parameters of the circular orbit fit v = γ + K sin(2π(φ − φ0)) applied to observed radial velocity curves of different species.
The Ca ii radial velocity curves were also fitted with sine curves assuming a circular orbit, and the results are collected in Table 1. The fits display some systematic residuals due either to bias from the underlying Paschen lines or from a true non-sinusoidal behavior.
The values of γ found here and by Schwope et al. (1997) for the He ii 4686 line differ at the 2−3σ level (statistical errors only). Systematic effects due to omission or inclusion of certain data points described in Schwope et al. (1997) and wavelength calibration uncertainties of a few km s-1 in both datasets may render the difference harmless. We make no attempt here to constrain the irradiation model further based on the measured γ and a possible difference with respect to previous publications.
The phase offset (φ0 = 0.007) of the Na i lines is marginally significant, and seems to be indicative of asymmetric irradiation of the secondary star due to shielding by an accretion curtain. Further insight into this matter is provided by Doppler tomography and we show Doppler maps constructed from phase-resolved spectroscopy of the Ca ii lines, the Na lines, and the He ii lines in Fig. 3; the latter already shown in Schwope (2001, reproduced with permission). The Doppler map of the Heii 4686 emission line has a strong stream component at vx < 150 km s-1. In accord with the trailed spectrogram and the Gaussian fits (Fig. 2), the Na lines are lacking flux from the region around the inner Lagrangian point L1, where the He lines appear strongest. The tomogram of the Na lines however shows some spill over from the non-irradiated hemisphere into the irradiated hemisphere. This situation complicates a mass estimate using the radial velocity curve. The accretion curtain blocks some of the ionizing radiation, leading to stronger He line emission from the trailing side of the secondary star and, at the same time, to stronger Na i absorption on the leading side behind the curtain. In the right panel of the same figure, the Doppler maps of the Na i absorption line and the Ca ii 8498 emission line are compared. The Ca line is clearly less affected by asymmetric irradiation and shows a better match to the Roche lobe for the chosen mass ratio of Q = 4.58 compared to the He ii emission line.
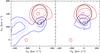 |
Fig. 3 Doppler maps of He ii4686 and Na i8183/8194 (left panel, blue and red contours, respectively) and Ca ii 8498 plus Na i8183/8194 (right panel) obtained in the September 1996 intermediate state of accretion. The size of the Roche lobe corresponds to Q = M1/M2 = 4.58. The left panel was adopted from Schwope (2001). |
Apart from the stronger underlying Paschen lines, the Ca ii line profiles observed here are very similar to those of EF Eridani in its low state (Schwope & Christensen 2010). We thus apply to the data of HU Aqr the same irradiation model as applied to EF Eri. For more details of the model see Schwope & Christensen (2010) or Beuermann & Reinsch (2008).
We computed synthetic line profiles for emission and absorption lines originating from an irradiated star. We assume velocity smearing as the only broadening mechanism, which seems justified by the high observed Doppler velocities. For the emission line we assume optically thin instantaneous re-emission of the incident radiation with the local flux being proportional to the solid angle subtended by a surface element as seen from the white dwarf. Absorption lines are synthesized as a sum of all non-irradiated surface elements with weights proportional to their size and their foreshortening at given phase angle. This means that we initially assume complete depletion of the irradiated hemisphere of Na absorption, an assumption that will be relaxed below. The synthesized line profiles were degraded to the instrumental resolution and radial velocity curves, the line width and the line flux variability were determined by Gaussian fits to individual line profiles. Input parameters are the mass ratio Q, the secondary star’s mass M2, the orbital period Porb and the orbital inclination i. The orbital period is well-known, 7501 s. The inclination was assumed to be 85°; a small deviation of order 1° or 2° from this value has negligible influence on the results otherwise. The mass ratio was varied between 3.5 and 5.5. Here we assume that the secondary is close to Knigge’s donor sequence (Knigge 2006, 2007), for which a mass of 0.19 M⊙ is expected at HU Aqr’s period. We will revisit these mass constraints in the next section.
Results of those models and their analysis are shown in Figs. 2 and 4. In Fig. 2 the modeled line widths and line fluxes are compared with the observed data, while Fig. 4 is used to constrain the mass ratio using the radial velocity amplitudes. This Figure shows in the upper panel as a diagonal line the predicted radial velocity semi-amplitude of the non-irradiated hemisphere together with the measured velocity of the Na lines (horizontal line with 1σ error bar). In the lower panel the diagonal indicates the predicted radial velocity semi-amplitude from emission lines originating fom the irradiated hemisphere.
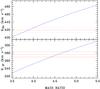 |
Fig. 4 Observed and predicted radial velocity amplitudes of the secondary star in HU Aqr. Blue lines from bottom left to upper right indicate model data for the irradiated and non-irradiated hemispheres of the donor star in the lower and upper panels, respectively. Red horizontal lines in the upper panel indicate the observed radial velocity amplitude of the Na i lines with their 1σ error bars. Red dashed lines in the lower panel indicate the radial velocity of the Ca ii 8498 line with 1σ error bar. The dotted horizontal line represents the combined fit to both Ca ii lines, the dashed-dotted line indicates the radial velocity amplitude of the Hα line observed on the night 1996 Sep. 4–5. |
3. Discussion and conclusions
The secondary in HU Aqr is strongly affected by irradiation from the white dwarf and the accretion spot. The prominent Na i absorption lines at 8183/8194 Å appear strongly suppressed when the star is viewed at phase 0.5. Whether heating makes the lines gradually disappear or if the absorption lines are filled with emission cannot be decided given the low signal-to-noise ratio of our data. The analysis of EX Hya based on UVES spectroscopy gave a clear preference for the second option (Beuermann & Reinsch 2008). A proof would be possible with detailed computations of X-ray and UV irradiated late-type stars as performed by Barman et al. (2004), computations which are not available to us.
Hydrogen and helium lines observed in polars are known to display complex line profiles, a pronounced feature being a narrow emission-line component originating from the X-ray and UV-irradiated hemisphere of the companion star. The radial velocity semi-amplitude of those lines was observed to be different for various atomic species even when obtained from the same set of spectra.
Here we have presented an analysis of the Na i absorption and Ca ii emission lines observed when the star was in an intermediate state of accretion.
The Na lines are saturated, they are fully resolved, they appear broader than predicted by the irradiation model and their width does not show significant orbital variability. Their light curve appears flat-topped, hence there is excess light around phase 0.7 and 1.3 with respect to the model. Under the assumption that the Na absorption lines originate only from the non-irradiated hemisphere of the companion star, the measured radial velocity amplitude gives a mass ratio of Q = 3.88 ± 0.15. The Doppler map shown in Fig. 3 gives evidence for a spill-over of Na absorption into the irradiated hemisphere, hence the observed radial velocity amplitude may be lower compared to lines originating only from the non-irradiated hemisphere. We thus regard Q = 3.7 as a strict lower limit of the mass ratio.
The width and the line flux variability of the Ca lines on the other hand seems to be more compatible with the irradiation model (see the lower panels in Fig. 2). An excess of the observed line width over the prediction is observed around phases 0.3 and 0.65, when the underlying emission component from the accretion stream crosses the narrow emission line originating from the secondary star. For the same reason there is also some excess line flux at the same phases.
Under the assumption that the Ca lines originate from the irradiated hemisphere the implied mass ratio is 4.58 ± 0.16. Both mass ratio estimates are compatible with each other at the 2σ level. We argue that shielding of the secondary star by the accretion curtain leads to a biased radial velocity determination with respect to the irradiaton model. If irradiation does not deplete Na absorption completely, the measured radial velocity semi-amplitude will be smaller than that of the non-irradiated hemisphere. Shielding may also explain the smaller than expected line flux variability of the Na lines. We test this scenario by computing line profiles of absorption lines from a grey/white instead of a black/white irradiated companion star and indeed find agreement with the observed radial-velocity semi-amplitude of 420 km s-1 for Q = 4.6 (as for the Ca lines) for an effective depletion of the irradiated hemisphere by 50%. This model gives almost flat line-flux and line-width curves (see the dashed lines in the lower panels of Fig. 2), which resemble the observations closer than the black/white model did. We do not claim to have found a flat brightness distribution over the irradiated hemisphere but use these model calculations to argue that the Ca lines appear to be better suited to constrain the mass ratio than the Na lines due to their more localized origin.
The implied mass ratio determined for Ca ii 8498 is Q = 4.58 ± 0.15. The combined fit to both Ca lines indicates a slightly lower mass ratio, Q = 4.38. We regard this result as potentially more biased because of the underlying Paschen line and assume as a final result for the Ca lines Q = 4.58 ± 0.2. This encompasses the radial velocity amplitude from both measurements of Ca lines.
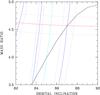 |
Fig. 5 Eclipse length (black curves), length of white-dwarf eclipse ingress and egress (blue & cyan curves), and radial velocity semi-amplitude (red curves) are used to constrain the mass ratio, the orbital inclination and the white dwarf mass. The solid lines indicate nominal observed values and the parallel dashed lines their 1σ uncertainties. |
The new radial velocity measurements can be used to further constrain the masses of the two stars in the binary in combination with the most recent photometric results. Using high-speed ULTRACAM photometry obtained in a low accretion state, Vogel et al. (2008) identified the four contact points of the white dwarf’s eclipse, re-determined the eclipse length, Δtecl = (586.3 ± 0.3) s, and measured the length of the white dwarf’s ingress and egress, Δting = (30.6 ± 0.3) s. They inferred a white dwarf mass of (0.879 ± 0.005) M⊙ for an assumed orbital inclination of i = 85.6°. Taking their measured lengths of eclipse and ingress/egress at face value we simulated eclipse light curves to further improve on the binary parameters. The mass ratio was varied between Q = M1/M2 = 3...5, the inclination between 80° and 90°, and the white dwarf mass between 0.6 M⊙ and 1 M⊙. A crucial input for those models is the assumed mass-radius relation of the white dwarf. We used that of Nauenberg (1972) with a 4% correction which gives very good agreement with the various white dwarf models of Panei et al. (2000) for a temperature of 15 000 K (Vogel et al. 2008).
Our results are displayed in Fig. 5 as contours in the (Q,i) plane. The curves stretching from the lower left to the upper right are defined by the measured eclipse length. The horizontal curves are defined by the radial velocity semi-amplitude of the Ca lines, and the vertical curves illustrate the constraints from the length of eclipse ingress/egress for a given white dwarf mass. Those curves depend very sensitively on the assumed mass and radius of the white dwarf, which was varied between 0.8 M⊙ (right curves) and 0.9 M⊙ in steps of 0.05 M⊙. The effect of the radius bloating factor with respect to Nauenberg’s relation is illustrated by the curve in cyan for an 0.8 M⊙ white dwarf. A white dwarf with 0.75 M⊙ has a too large a radius to give a solution in Fig. 5.
The eclipse parameters alone thus constrain the white dwarf mass to
0.75 < MWD/M⊙ < 0.84. All
three observables intersect at a common point for
MWD = 0.80 M⊙. The derived values
and 1σ error ranges for the inclination, the mass ratio and the mass of the
secondary star are  M⊙. The mass
found for the secondary star is in full accord with the donor sequence by Knigge (2006, 2007). M2 = 0.187 M⊙ is
expected at this period, and this result is only weakly dependent on the use of this
relation for our synthetic line profiles. The mass of the secondary at the extremes of the
binary solution is 0.23 M⊙ for
(Q,MWD/M⊙) = (3.7,0.84)
and 0.15 M⊙ for
(Q,MWD) = (4.9,0.75).
M⊙. The mass
found for the secondary star is in full accord with the donor sequence by Knigge (2006, 2007). M2 = 0.187 M⊙ is
expected at this period, and this result is only weakly dependent on the use of this
relation for our synthetic line profiles. The mass of the secondary at the extremes of the
binary solution is 0.23 M⊙ for
(Q,MWD/M⊙) = (3.7,0.84)
and 0.15 M⊙ for
(Q,MWD) = (4.9,0.75).
It is worth reiterating the values of the basic stellar parameters and compare them with those found in the literature. Glenn et al. (1994) find M1 ≈ 0.9 M⊙, M2 ≈ 0.3 M⊙, and i = 80° ± 5° from their estimated velocity of the secondary star and the eclipse width. Schwope et al. (1997) were using the same type of data obtained with higher signal-to-noise and reached similar conclusions with a slight preference towards a higher mass ratio than Glenn et al., Q = 4−5.5, and a higher inclination, i > 85°. Major uncertainties in these studies were the interpretation of the narrow emission lines and the proper correction to the velocity of the center of mass, and the uncertain eclipse length. The measured quantity in the high state was the length of the spot eclipse and not the eclipse of the white dwarf proper. Heerlein et al. (1999), assuming i = 84°, derived Q = 3.9,M1 = 0.75 M⊙ and M2 = 0.19 M⊙ by fitting the location and curvature of the ballistic stream in Doppler maps using the same data as in Schwope et al. (1997). This novel approach rests on the assumption that the Doppler velocity in the not-yet magnetically threadened part of the stream reflects just the free-fall velocity with some thermal broadening. Multi-epoch tomography of QQ Vul has cast doubt on this assumption (Schwope et al. 2000). Watson et al. (2003) used Roche tomography reconstructions of the secondary star in HU Aqr to derive the system parameters (MWD,M2,i,γ) from the shape of the entropy landscape. The reconstruction was based on He ii line profiles obtained in a high accretion state (Schwope et al. 1997) and corrected for emission components originating from the accretion stream. Their values, MWD = 0.61 M⊙, M2 = 0.15 M⊙, Q = 4, and i = 84.4°, depend on the assumed systemic velocity γ = 7 km s-1 and the assumed eclipse length of 572 s, meanwhile corrected to 583.3 s. One of their conclusions was that “knowledge of the intensity distribution across the secondary is required to accurately determine the systemic velocity” (the same conclusion was reached previously by Schwope et al. 1997). The Ca lines used in the present work seem to be better qualified in this respect compared to the brighter lines with a higher ionization potential used in previous studies. Our combination of using the Ca ii lines in conjunction with an improved determination of the white dwarf eclipse parameters leads us to believe that our revised binary parameters represent the most reliable constraints thus far.
When we analysed the narrow emisison line of He ii 4686, traced through the orbital cycle in a high state of accretion (Schwope et al. 1997), we concluded that it appears unlikely that the narrow emission lines with an appropriate K2-correction can be used directly to give an accurate mass estimate (see also the thorough discussion of the origin of narrow emission lines and K2 correction schemes by Catalán et al. 1999). This assessment needs to be revised. The recent analyses of EF Eri (Schwope & Christensen 2010), EX Hya (Beuermann & Reinsch 2008) and the present one of HU Aqr successfully make use of the Ca lines which appear less influenced by shielding and less contaminated by stream emission than other species. For those reasons, the Balmer lines, although most prominent in the spectra of polars,
are clearly not suited for that exercise. This is exemplified by the narrow emission line of Hα obtained during the same observation run with a radial velocity semi-amplitude of 311 km s-1, which cannot be made compliant with the other species (dashed-dotted line in the lower panel of Fig. 4) within the framework of the irradiation model.
The low Ca i ionization potential of 6.1 eV, lower than the ionization potential of hydrogen, seems to ensure full and mainly unshielded irradiation of the secondary, while the ionizing photons causing H and He emission have to pass the accretion stream or an accretion curtain which may lead to a very complex irradiation pattern. The resulting radial velocity semi-amplitudes will appear somehow biased. We thus recommend the preferential use of the Ca ii triplet for mass estimates in magnetic and non-magnetic cataclysmic variables (cf. van Spaandonk et al. 2010; Beuermann & Reinsch 2008).
Acknowledgments
We acknowledge careful reading and helpful comments from our referee Christian Knigge.
The left panel of Fig. 3 was reproduced with kind permission from Springer Science+Business Media from an article by Schwope (2001).
References
- Barman, T. S., Hauschildt, P. H., & Allard, F. 2004, ApJ, 614, 338 [NASA ADS] [CrossRef] [Google Scholar]
- Beuermann, K., & Reinsch, K. 2008, A&A, 480, 199 [NASA ADS] [CrossRef] [EDP Sciences] [Google Scholar]
- Bridge, C. M., Cropper, M., Ramsay, G., et al. 2002, MNRAS, 336, 1129 [NASA ADS] [CrossRef] [Google Scholar]
- Catalán, M. S., Schwope, A. D., & Smith, R. C. 1999, MNRAS, 310, 123 [Google Scholar]
- Glenn, J., Howell, S. B., Schmidt, G. D., et al. 1994, ApJ, 424, 967 [NASA ADS] [CrossRef] [Google Scholar]
- Hakala, P. J., Watson, M. G., Vilhu, O., et al. 1993, MNRAS, 263, 61 [NASA ADS] [CrossRef] [Google Scholar]
- Harrop-Allin, M. K., Cropper, M., Hakala, P. J., Hellier, C., & Ramseyer, T. 1999, MNRAS, 308, 807 [NASA ADS] [CrossRef] [Google Scholar]
- Harrop-Allin, M. K., Potter, S. B., & Cropper, M. 2001, MNRAS, 326, 788 [NASA ADS] [CrossRef] [Google Scholar]
- Heerlein, C., Horne, K., & Schwope, A. D. 1999, MNRAS, 304, 145 [NASA ADS] [CrossRef] [Google Scholar]
- Howell, S. B., Ciardi, D. R., Sirk, M. M., & Schwope, A. D. 2002, AJ, 123, 420 [NASA ADS] [CrossRef] [Google Scholar]
- Knigge, C. 2006, MNRAS, 373, 484 [NASA ADS] [CrossRef] [Google Scholar]
- Knigge, C. 2007, MNRAS, 382, 1982 [NASA ADS] [Google Scholar]
- Nasiroglu, I., Slowikowska, A., Kanbach, G., Schwarz, R., & Schwope, A. 2010, in High Time Resolution Astrophysics IV, ed. A. Shearer, Am. Inst. Phys. Conf. Ser., Vol. PoS(HTRA-IV)048, in press [Google Scholar]
- Nauenberg, M. 1972, ApJ, 175, 417 [NASA ADS] [CrossRef] [Google Scholar]
- Panei, J. A., Althaus, L. G., & Benvenuto, O. G. 2000, A&A, 353, 970 [NASA ADS] [Google Scholar]
- Qian, S., Liu, L., Liao, W., et al. 2011, MNRAS, accepted [arXiv:1103.2005] [Google Scholar]
- Schwarz, R., Schwope, A. D., Vogel, J., et al. 2009, A&A, 496, 833 [NASA ADS] [CrossRef] [EDP Sciences] [Google Scholar]
- Schwope, A. 2001, in Astrotomography, Indirect Imaging Methods in Observational Astronomy, ed. H. M. J. Boffin, D. Steeghs, & J. Cuypers (Berlin: Springer Verlag), Lect. Notes Phys., 573, 127 [Google Scholar]
- Schwope, A. D., & Christensen, L. 2010, A&A, 514, A89 [NASA ADS] [CrossRef] [EDP Sciences] [Google Scholar]
- Schwope, A. D., Thomas, H. C., & Beuermann, K. 1993, A&A, 271, L25 [NASA ADS] [Google Scholar]
- Schwope, A. D., Mantel, K., & Horne, K. 1997, A&A, 319, 894 [NASA ADS] [Google Scholar]
- Schwope, A. D., Beuermann, K., Buckley, D. A. H., et al. 1998, in Wild Stars in the Old West, ed. S. Howell, E. Kuulkers, & C. Woodward, ASP Conf. Ser., 137, 44 [Google Scholar]
- Schwope, A. D., Catalán, M. S., Beuermann, K., et al. 2000, MNRAS, 313, 533 [NASA ADS] [CrossRef] [Google Scholar]
- Schwope, A. D., Schwarz, R., Sirk, M., & Howell, S. B. 2001, A&A, 375, 419 [NASA ADS] [CrossRef] [EDP Sciences] [Google Scholar]
- Schwope, A. D., Thomas, H., Mantel, K., Haefner, R., & Staude, A. 2003, A&A, 402, 201 [NASA ADS] [CrossRef] [EDP Sciences] [Google Scholar]
- Schwope, A. D., Staude, A., Vogel, J., & Schwarz, R. 2004, Astron. Nachr., 325, 197 [NASA ADS] [CrossRef] [Google Scholar]
- van Spaandonk, L., Steeghs, D., Marsh, T. R., & Torres, M. A. P. 2010, MNRAS, 401, 1857 [NASA ADS] [CrossRef] [Google Scholar]
- Vogel, J., Schwope, A., Schwarz, R., et al. 2008, in High Time Resolution Astrophysics: The Universe at Sub-Second Timescales, ed. D. Phelan, O. Ryan, & A. Shearer, AIP Conf. Ser., 984, 264 [Google Scholar]
- Vrielmann, S., & Schwope, A. D. 2001, MNRAS, 322, 269 [NASA ADS] [CrossRef] [Google Scholar]
- Watson, C. A., Dhillon, V. S., Rutten, R. G. M., & Schwope, A. D. 2003, MNRAS, 341, 129 [NASA ADS] [CrossRef] [Google Scholar]
All Tables
Parameters of the circular orbit fit v = γ + K sin(2π(φ − φ0)) applied to observed radial velocity curves of different species.
All Figures
|
Fig. 1 (Left) Light curve of HU Aqr obtained on Sep. 3–4, 1996. The quantity shown is the mean flux density averaged over the given wavelength range, units are 10-16 erg cm-2 s-1 Å-1. (Right) Orbital mean spectrum of HU Aqr after correcting individual spectra to radial velocity zero with a radial velocity semi-amplitude K2 = 280 km s-1. |
| In the text | |
|
Fig. 2 Line profile variations and parameters of the Na i absorption lines (left) and the Ca ii emission lines (right). The top row shows the phase-folded spectra arranged as a trailed spectrogram. The second row shows the measured line parameters. For Na i the same data are shown twice for clarity. Parameters of the Ca ii lines are derived from a combined fit to both lines (left) and from a fit to just the Ca ii 8498 (right). (Top panels) Observed radial velocities and residuals of sine fits. The fits are shown with blue solid lines. Dotted horizontal lines indicate the systemic velocity. (Middle panels) Full width of the lines at half maximum, solid lines indicate predictions of our illumination model for Q = M1/M2 = 4.6. (Bottom panels) Observed and predicted orbital light curves (flux units are 10-16 erg cm-2 s-1 , the model curves were scaled arbitrarily). |
| In the text | |
|
Fig. 3 Doppler maps of He ii4686 and Na i8183/8194 (left panel, blue and red contours, respectively) and Ca ii 8498 plus Na i8183/8194 (right panel) obtained in the September 1996 intermediate state of accretion. The size of the Roche lobe corresponds to Q = M1/M2 = 4.58. The left panel was adopted from Schwope (2001). |
| In the text | |
|
Fig. 4 Observed and predicted radial velocity amplitudes of the secondary star in HU Aqr. Blue lines from bottom left to upper right indicate model data for the irradiated and non-irradiated hemispheres of the donor star in the lower and upper panels, respectively. Red horizontal lines in the upper panel indicate the observed radial velocity amplitude of the Na i lines with their 1σ error bars. Red dashed lines in the lower panel indicate the radial velocity of the Ca ii 8498 line with 1σ error bar. The dotted horizontal line represents the combined fit to both Ca ii lines, the dashed-dotted line indicates the radial velocity amplitude of the Hα line observed on the night 1996 Sep. 4–5. |
| In the text | |
|
Fig. 5 Eclipse length (black curves), length of white-dwarf eclipse ingress and egress (blue & cyan curves), and radial velocity semi-amplitude (red curves) are used to constrain the mass ratio, the orbital inclination and the white dwarf mass. The solid lines indicate nominal observed values and the parallel dashed lines their 1σ uncertainties. |
| In the text | |
Current usage metrics show cumulative count of Article Views (full-text article views including HTML views, PDF and ePub downloads, according to the available data) and Abstracts Views on Vision4Press platform.
Data correspond to usage on the plateform after 2015. The current usage metrics is available 48-96 hours after online publication and is updated daily on week days.
Initial download of the metrics may take a while.