Fig. 4
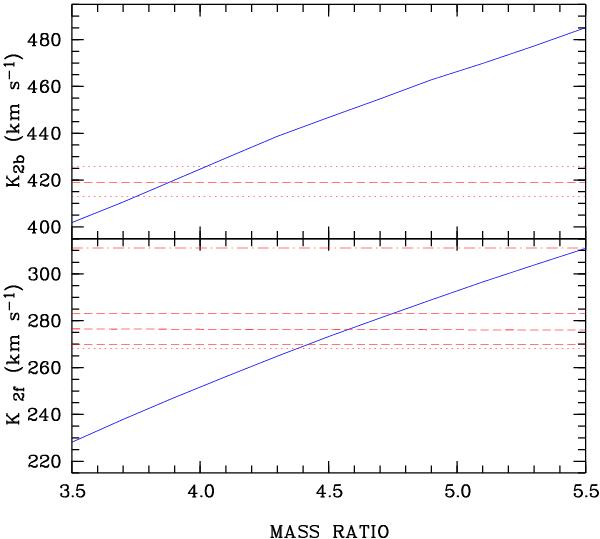
Observed and predicted radial velocity amplitudes of the secondary star in HU Aqr. Blue lines from bottom left to upper right indicate model data for the irradiated and non-irradiated hemispheres of the donor star in the lower and upper panels, respectively. Red horizontal lines in the upper panel indicate the observed radial velocity amplitude of the Na i lines with their 1σ error bars. Red dashed lines in the lower panel indicate the radial velocity of the Ca ii 8498 line with 1σ error bar. The dotted horizontal line represents the combined fit to both Ca ii lines, the dashed-dotted line indicates the radial velocity amplitude of the Hα line observed on the night 1996 Sep. 4–5.
Current usage metrics show cumulative count of Article Views (full-text article views including HTML views, PDF and ePub downloads, according to the available data) and Abstracts Views on Vision4Press platform.
Data correspond to usage on the plateform after 2015. The current usage metrics is available 48-96 hours after online publication and is updated daily on week days.
Initial download of the metrics may take a while.