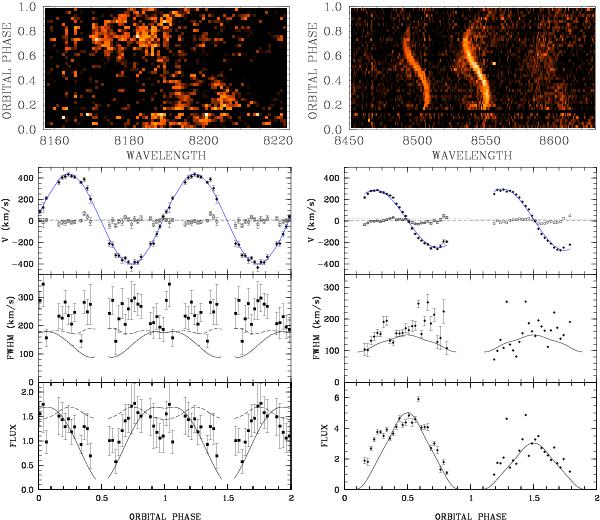
Fig. 2

Line profile variations and parameters of the Na i absorption lines (left) and the Ca ii emission lines (right). The top row shows the phase-folded spectra arranged as a trailed spectrogram. The second row shows the measured line parameters. For Na i the same data are shown twice for clarity. Parameters of the Ca ii lines are derived from a combined fit to both lines (left) and from a fit to just the Ca ii 8498 (right). (Top panels) Observed radial velocities and residuals of sine fits. The fits are shown with blue solid lines. Dotted horizontal lines indicate the systemic velocity. (Middle panels) Full width of the lines at half maximum, solid lines indicate predictions of our illumination model for Q = M1/M2 = 4.6. (Bottom panels) Observed and predicted orbital light curves (flux units are 10-16 erg cm-2 s-1 , the model curves were scaled arbitrarily).
Current usage metrics show cumulative count of Article Views (full-text article views including HTML views, PDF and ePub downloads, according to the available data) and Abstracts Views on Vision4Press platform.
Data correspond to usage on the plateform after 2015. The current usage metrics is available 48-96 hours after online publication and is updated daily on week days.
Initial download of the metrics may take a while.


