| Issue |
A&A
Volume 530, June 2011
|
|
|---|---|---|
| Article Number | C1 | |
| Number of page(s) | 1 | |
| Section | Stellar structure and evolution | |
| DOI | https://doi.org/10.1051/0004-6361/201016073 | |
| Published online | 10 May 2011 | |
The VLT-FLAMES survey of massive stars: atmospheric parameters and rotational velocity distributions for B-type stars in the Magellanic Clouds⋆ (Corrigendum)
1
Astrophysics Research Centre, School of Mathematics & Physics,
The Queen’s University of Belfast, Belfast, BT7 1NN, Northern
Ireland, UK
e-mail: This email address is being protected from spambots. You need JavaScript enabled to view it.
2
The Isaac Newton Group of Telescopes, Apartado de Correos 321, 38700, Santa Cruz de La Palma, Canary
Islands, Spain
3
Instituto de Astrofísica de Canarias, 38200 La Laguna, Tenerife, Spain
4
LUTH, Observatoire de Meudon, 5 place Jules Janssen, 92195
Meudon Cedex,
France
5
UK Astronomy Technology Centre, Royal Observatory,
Blackford Hill, Edinburgh, EH9 3HJ, UK
Key words: stars: early-type / stars: atmospheres / stars: rotation / stars: evolution / galaxies: Magellanic Clouds / errata, addenda
Based on observations at the European Southern Observatory in programmes 171.0237 and 073.0234.
An error occurred during the production process. Figure 1 was published twice. The corrected Figs. 1 and 2 are published below.
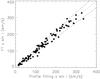 |
Fig. 1 Comparison of the projected rotational velocity derived by the profile fitting method and the Fourier transform method for the non-supergiant objects in the sample. The dotted line indicates a one-to-one correlation. The dashed lines indicate a 10% or 10 km s-1 uncertainty, whichever is the larger. |
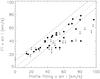 |
Fig. 2 Comparison of the projected rotational velocity (vsini) derived by the profile fitting method and the Fourier transform method for the supergiant objects in the sample. The dotted line indicates a one-to-one correlation. The dashed lines indicate a 10 km s-1 uncertainty. Downward pointing arrows indicate those objects where it was only possible to derive upper limits to the vsini from the Fourier method. |
© ESO, 2011
All Figures
|
Fig. 1 Comparison of the projected rotational velocity derived by the profile fitting method and the Fourier transform method for the non-supergiant objects in the sample. The dotted line indicates a one-to-one correlation. The dashed lines indicate a 10% or 10 km s-1 uncertainty, whichever is the larger. |
| In the text | |
|
Fig. 2 Comparison of the projected rotational velocity (vsini) derived by the profile fitting method and the Fourier transform method for the supergiant objects in the sample. The dotted line indicates a one-to-one correlation. The dashed lines indicate a 10 km s-1 uncertainty. Downward pointing arrows indicate those objects where it was only possible to derive upper limits to the vsini from the Fourier method. |
| In the text | |
Current usage metrics show cumulative count of Article Views (full-text article views including HTML views, PDF and ePub downloads, according to the available data) and Abstracts Views on Vision4Press platform.
Data correspond to usage on the plateform after 2015. The current usage metrics is available 48-96 hours after online publication and is updated daily on week days.
Initial download of the metrics may take a while.