Fig. 2
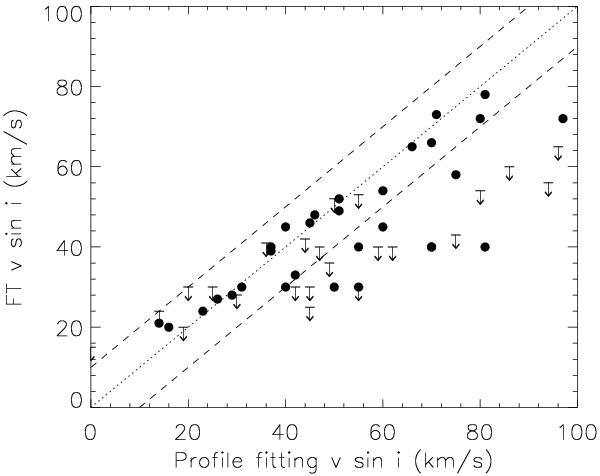
Comparison of the projected rotational velocity (vsini) derived by the profile fitting method and the Fourier transform method for the supergiant objects in the sample. The dotted line indicates a one-to-one correlation. The dashed lines indicate a 10 km s-1 uncertainty. Downward pointing arrows indicate those objects where it was only possible to derive upper limits to the vsini from the Fourier method.
Current usage metrics show cumulative count of Article Views (full-text article views including HTML views, PDF and ePub downloads, according to the available data) and Abstracts Views on Vision4Press platform.
Data correspond to usage on the plateform after 2015. The current usage metrics is available 48-96 hours after online publication and is updated daily on week days.
Initial download of the metrics may take a while.