| Issue |
A&A
Volume 530, June 2011
|
|
|---|---|---|
| Article Number | A23 | |
| Number of page(s) | 11 | |
| Section | Extragalactic astronomy | |
| DOI | https://doi.org/10.1051/0004-6361/201015881 | |
| Published online | 02 May 2011 | |
Hubble Space Telescope study of resolved red giant stars in the outer halos of nearby dwarf starburst galaxies
1
Space Telescope Science Institute, 3700 San Martin Drive, Baltimore, MD 21218, USA
2
Astronomical Observatory, Adam Mickiewicz University, Słoneczna 36, 60-286 Poznań, Poland
3
Insituto de Astrofísica de Canarias (IAC), 38200 La Laguna, Tenerife, Spain
e-mail: This email address is being protected from spambots. You need JavaScript enabled to view it.
4
Departamento de Astrofísica, Universidad de La Laguna (ULL), 38205 La Laguna, Tenerife, Spain
5
Astronomy Department, Yale University, New Haven, CT 06520, USA
6
INAF – Osservatorio Astronomico di Padova, vicolo dell’Osservatorio 5, 35122 Padova, Italy
Received: 6 October 2010
Accepted: 29 March 2011
Abstract
Context. Central starbursts in galaxies are an extreme example of ongoing galaxy evolution. The outer parts of galaxies contain a fossil record of galaxy formation and evolution processes in the more distant past. The characterization of resolved stellar populations allows one a detailed study of these topics.
Aims. We observed the outer parts of NGC 1569 and NGC 4449, two of the closest and strongest dwarf starburst galaxies in the local universe, to characterize their stellar density and populations, and obtain new insights into the structure, formation, and evolution of starburst galaxies and galaxy halos.
Methods. We obtained HST/WFPC2 images between 5 and 8 scale radii from the center, along the intermediate and minor axes. We performed point-source photometry to determine color magnitude diagrams of I vs. V − I. We compared the results at different radii, including also our prior HST/ACS results for more centrally located fields.
Results. We detect stars in the RGB and TP-AGB (carbon star) phases in all outer fields, but not younger stars such as those present at smaller radii. The RGB star density profile is well fit by either a de Vaucouleurs profile or a power-law profile, but has more stars at large radii than a single exponential. To within the uncertainties, there are no radial gradients in the RGB color or carbon-to-RGB-star ratio at large radii.
Conclusions. The galaxies have faint outer stellar envelopes that are not tidally truncated within the range of radii addressed by our study. The density profiles suggest that these are not outward extensions of the inner disks, but are instead distinct stellar halos. This agrees with other work on galaxies of similar morphology. The presence of such halos is consistent with predictions of hierarchical galaxy formation scenarios. The halos consist of intermediate-age/old stars, confirming the results of other studies that have shown the starburst phenomenon to be very centrally concentrated. There is no evidence for stellar-population age/metallicity gradients within the halos themselves.
Key words: galaxies: evolution / galaxies: individual: NGC 1569 / galaxies: individual: NGC 4449 / galaxies: irregular / galaxies: dwarf / galaxies: stellar content
© ESO, 2011
1. Introduction
The currently accepted theory of galaxy formation is that galaxies form hierarchically, with the growth and evolution of large systems driven by build-up through accretion and merging of smaller units (see e.g. Cole et al. 1994). These processes trigger intense, centrally concentrated bursts of star formation (SF) that provide chemical enrichment and thermal and mechanical heating of both the interstellar and intergalactic medium (Heckman 1998). While starburst galaxies are thought to be common at high redshift, the observational information available for such distant galaxies is very limited owing to their unresolved nature. In order to gain better understanding of the processes that govern galaxy formation we turn to nearby starbursting systems. These local analogs of distant starburst galaxies provide the opportunity for a very detailed study of galaxy formation since we are able to resolve individual stars in these galaxies with the Hubble Space Telescope (HST) and thereby build color-magnitude diagrams (CMDs), which are essential tools for determining ages and abundances of the underlying stellar populations.
In the local universe, starbursts are typically found in dwarf irregular galaxies. They are usually gas-rich systems with a chemical composition comparable to that of distant primeval galaxies (e.g. Thuan & Izotov 1999). Investigating the properties of underlying older populations in present-day starbursting systems is the key to understanding their evolution over the cosmological timescale. The presence of older populations is a proof that a given galaxy has also experienced episodes of SF in the past (e.g. Tosi et al. 1991; Grebel 1998).
A number of recent studies have aimed at describing the properties and the origin of extended stellar halos that contain these older populations in various galaxy types (see e.g. Seth et al. 2007; Seth et al. 2008; de Jong et al. 2009, for the results on giant spiral galaxies from the GHOST project; Tikhonov 2006a, for the massive irregular M 82; Vansevičius et al. 2004, for the very low-mass dIrr Leo A). Recent advanced simulations allow one to make predictions regarding halo chemical abundance trends (Zolotov et al. 2010) and their surface brightness profiles following different formation scenarios (e.g. Cooper et al. 2010); they also show that the halos could have formed both as a result of mergers (Bekki 2008) or because of internal processes in isolated galaxies (Stinson et al. 2009).
NGC 1569 and NGC 4449 are two of the closest and strongest starburst galaxies, at a distance of 3.04 Mpc (Grocholski et al., in prep.) and 3.82 Mpc (Annibali et al. 2008), respectively. Both have been studied extensively with HST before (e.g. Greggio et al. 1998; Aloisi et al. 2001; Angeretti et al. 2005; Blair & Fesen 1998; and Gelatt et al. 2001) and are known to display interesting and unusual properties. NGC 1569 has a star-formation rate (SFR) per unit area that is 2−3 times higher than in other strong starbursts and 2−3 orders of magnitude higher than in Local Group dwarf irregulars (Aloisi et al. 2001; McQuinn et al. 2010). Its three super star clusters are among the most massive and luminous in the local universe, making the galaxy an extreme example of a starburst. NGC 4449, with the recent SFR of ~1 M⊙/yr (McQuinn et al. 2010), is the only local “global” starburst, in that star formation appears to occur throughout much of the galaxy (Hunter 1997).
The recent analysis of deep HST/ACS photometry by Grocholski et al. (2008) and Annibali et al. (2008; see Figs. 1 and 2 for mosaicked ACS images) revealed a variety of stellar ages and metallicities in both galaxies, including well-defined populations of red giant branch stars. With WFPC2 data that were obtained in parallel it is possible to extend this analysis to much larger galactocentric radii, which is the topic of the present paper. We detect and quantify the presence of old stars at large radii (Sect. 2). We study stellar population gradients through variations in the red giant branch (RGB) color and the relative number of carbon stars as a function of radius (Sect. 3). An analysis of density profiles as traced by RGB star counts allows us to address the question whether the stars at large radii form a halo component or an extension of the inner disk (Sect. 4). Finally, we discuss the results and compare them with the literature (Sect. 5).
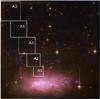 |
Fig. 1 ACS 3-color F658N (Hα), F814W (I) and F606W (V) composite image of NGC 1569 showing the locations of ACS subfields. Owing to the decrease in stellar density in the outer portions of the galaxy, we increased the size of our boxes as we move outward from the center of the galaxy. |
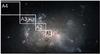 |
Fig. 2 ACS 4-color F435W (B), F555W (V), F814W (I), and F658N (Hα) composite image of NGC 4449 showing the locations of ACS subfields. See the caption of Fig. 1 for the explanation of different box sizes. |
2. Observations
2.1. Fields
We have observed both NGC 1569 and NGC 4449 with ACS and WFPC2. In both cases, ACS was centered on each galaxy with parallel WFPC2 imaging of a region ~6′ away from the galactic centers.
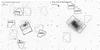 |
Fig. 3 Hubble Legacy Archive footprints: ACS and WFPC2 fields (black) for NGC 1569 (left) and NGC 4449 (right) pointings overlaid on Digitized Sky Survey (DSS) images. The fields depicted in light gray come from programs other than those listed in Table 1 and are not discussed in this paper because they do not go deep enough to contribute to our analysis. |
Our NGC 1569 data were taken during the HST Cycle 15 program 10885 in November 2006 and February 2007 (PI: A. Aloisi). Between the two sets of observations, HST was rotated roughly 90 degrees so that, while ACS was centered on the galaxy, the parallel WFPC2 observations image two distinct regions in the outskirts of NGC 1569.
NGC 4449 was imaged as a part of the Cycle 14 program 10585 in November 2005 (PI: A. Aloisi). To fully image the galaxy’s center, ACS data were taken at two adjacent, but overlapping, positions. As a result, the parallel WFPC2 images are also adjacent to each other and overlap slightly.
For both galaxies the WFPC2 images were taken in F606W and F814W broadband filters, which roughly correspond to standard V and I filters in the Johnson-Cousins system. The ACS images were taken in F606W/F814W for NGC 1569 and in F555W/F814W for NGC 4449. We here present the first photometric analysis of the WFPC2 data and combine this with the previously published ACS data for the galactic centers (Grocholski et al. 20081; and Annibali et al. 2008).
Table 1 lists the coordinates (α and δ), adopted major axis position angles, axial ratios and distances, number of frames, total exposure times, galactocentric radii and elliptical radii (the latter being the major axis radius of the corresponding isophote). The exact locations of all WFPC2 fields are shown in Fig. 3 in black.
Other WFPC2 pointings are also available from the HST archive (programs 6111, 6253, 6423, 7909, 8059, 8133, 8544, 9244, 9249 and 9634 for NGC 1569 and 5446, 5971, 6716, 8601, 9244 and 10522 for NGC 4449), as shown in Fig. 3. However, only the data from the GO-8059 program (PI: S. Casertano) are deep enough for our purposes and are used here.
Observed fields.
2.2. Reduction
For each filter and pointing the WFPC2 frames were processed through the HST data archive on-the-fly reprocessing system, using the most up-to-date reference files and software. They were then combined into a single mosaicked image using the software package MultiDrizzle (Koekemoer et al. 2002) to improve the sampling of the point-spread function (PSF) as well as to remove cosmic rays, bad pixels and correct for geometric distortions. In order to decide on the optimal pixfrac (the linear size of the “drop” in input pixels) and pixscale (the size of output pixels) values the so called “grid experiment” was carried out, following the recipe given in Fruchter & Sosey (2009). Its purpose was to determine what combinations of the two parameters provide the best resolution and PSF sampling for our dithered images. The general approach is that the pixfrac should be slightly larger than the pixscale value to allow parts of each “drop” to spill over to adjacent pixels. We found that for most of the images pixfrac=0.7 and pixscale=0.6 provided the best resolution and PSF sampling. An example of a drizzled image is shown in Fig. 4.
 |
Fig. 4 Drizzled combination of 32 1000/1100 s images for NGC 1569, field 10885/1, F606W, WF3 chip. |
2.3. PSF photometry
Point-source photometry was performed with the stand-alone version of the DAOPHOT/ALLSTAR stellar photometry package (Stetson 1987) following the method described in Grocholski et al. (2008). A set of plots was created for each pointing showing magnitude versus σ (the uncertainty on the magnitude), χ2 (the residual per degree of freedom of the PSF-fitting procedure) and sharpness (a measure of the intrinsic size of the object with respect to the PSF where 0 indicates a “perfect” star, a negative value is indicative of, e.g. bad pixels or cosmic rays, and a positive value indicates extended objects, such as faint background galaxies or unresolved star clusters). An example is shown in Fig. 5 where we can see that the σ increases toward fainter magnitudes as expected. The χ2 values increase toward brighter magnitudes, which is because systematic errors in the PSF model are more statistically significant at lower noise levels. The sharpness distribution widens toward fainter magnitudes, likely indicating increasing contamination from non-stellar sources.
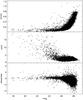 |
Fig. 5 Distribution of the DAOPHOT parameters σ (top), sharpness (middle), and χ2 (bottom) as a function of F814W VEGAMAG magnitude (a rough approximation of the Johnson-Cousins I) for NGC 1569, field 10885/1. |
2.4. Aperture and CTE corrections
The PSF magnitudes computed within ≈ 10 pixel radius were corrected to the standard 0 5 aperture for which the filter magnitude zeropoints are known. The second step was to correct these values to the hypothetical infinite aperture, which was done by applying a 0.1 mag offset (Holtzman et al. 1995).
Corrections for imperfect charge transfer efficiency (CTE) were calculated using the prescription by Dolphin (2009). The computed corrections for most stars were modest, owing to the high sky backgrounds resulting from long exposures in broad-band filters. However, the corrections were as high as ≈0.14 mag for faint stars located far from the readout amplifier.
2.5. Johnson-Cousins transformation
The conversion of count rates DN/s into the standard Johnson-Cousins system was performed following the formulae by Holtzman et al. (1995) but using an updated set of zeropoints and transformation coefficients (Dolphin 2009). The transformation formula is of the following form:  (1)where SM is the standard magnitude, SC the standard color, T1, T2 the transformation coefficients, Z the zero point and GR the gain ratio (slightly different for each chip). It was also necessary to specify multiple fits for both filters to accurately cover the entire color range: the transformation formula uses different coefficients for the color ranges <2.0 and >2.0.
2.6. Color–magnitude diagrams
Figures 6 and 7 show CMDs of two of our ACS subfields (innermost and outermost) as well as all of the WFPC2 fields for NGC 1569 and NGC 4449, respectively. For the WFPC2 fields we used the photometric quality parameters provided by DAOPHOT to remove false detections. Because the fields are sparse, fairly lenient cut values were chosen to maintain clear CMDs.
In the case of NGC 1569 we applied the following cuts to each WFPC2 catalog: σ ≤ 0.3 and −1.0 ≤ sharpness ≤ 1.0. No cuts in χ2 were applied since this would reject many real stars at the bright end of the CMD. A final check was made by visually inspecting the frames with “cleaned” catalogs overplotted to make sure that no spurious objects were present or no real stars were being rejected. The catalogs contain 1176, 136, 675 and 391 stars for fields 10885/1, 10885/2, 8059/1 and 8059/2, respectively.
For the NGC 1569 ACS subfields we used the same photometric cuts as in Grocholski et al. (2008). The subfields contain 7570 (A1), 11173 (A2), 8570 (A3), 3441 (A4) and 926 (A5) stars.
 |
Fig. 6 CMDs of the innermost (top left) and outermost ACS (top right) subfield and the four WFPC2 fields (middle and bottom) for NGC 1569. The dashed-dotted lines indicate the calculated TRGB values and the long-dashed lines show 50% completeness levels. The two boxes shown in the 10885/1 plot indicate adopted color and I-magnitude ranges for selecting RGB and carbon stars (see Sects. 3.3, 3.4 and 4.1 for details). Smaller plot symbols are used for the A1 subfield to avoid its saturation and make the different CMD features visible. |
For NGC 4449 there was little evidence for bright stars in the WFPC2 fields. This allowed us to adopt more stringent cut values than for NGC 1569. Applying the cuts σ ≤ 0.4, −0.5 ≤ sharpness ≤ 0.5 and χ2 < 3.0 allowed us to make sure that we were neither cutting out real stars nor keeping a lot of false detections. The final cleaned catalogs contain 827 and 1681 stars in the first and second field, respectively.
The four NGC 4449 ACS subfields contain 4043 (A1), 11092 (A2), 10897 (A3) and 4510 (A4) stars. Again, the original cuts were applied (Annibali et al. 2008).
 |
Fig. 7 CMDs of the innermost (top left) and outermost ACS (top right) subfield and the two WFPC2 fields (bottom) for NGC 4449. See the caption of Fig. 6 for further details. |
2.7. Completeness
The completeness for all WFPC2 and ACS regions was estimated by performing artificial star experiments: artificial stars were added to the frames, each with a randomly assigned magnitude from the range observed in the real data. Then, the same photometry steps were taken as for the real data. The completeness was calculated in the individual filters, and then the final completeness was obtained by multiplying the completeness factors in the different filters (since in our photometry we require a star to be detected independently in each filter). The number of recovered stars divided by the number of stars used as the input provided the estimate of completeness as a function of magnitude and position. Both the ACS and WFPC2 50% completeness limits are shown in Figs. 6 and 7.
2.8. ACS photometry
Here we provide a short summary of the ACS photometric reduction for NGC 1569 and NGC 4449. Specific details can be found in Sect. 2 of Grocholski et al. (2008) and Sect. 2 of Annibali et al. (2008).
Total exposure times for NGC 1569 were 61716 s in the F606W filter and 24088 s in the F814W filter. For NGC 4449, the total integration times in F435W, F555W, and F814W were ~3600 s, 2400 s, and 2000 s, respectively. The individual images were processed through the ACS pipeline (CALACS) and combined into final images using the MULTIDRIZZLE software package (Fruchter et al. 2009).
Using the DAOPHOT/ALLSTAR software (Stetson 1987), we performed photometry in the following manner. The PSF template was computed from the most isolated stars in the frame to accurately model any spatial variations in the shape of the PSF. We then used ALLSTAR to fit the PSF to independent source detection lists for the images in all bands. The photometry lists were then cross-correlated, and the resulting catalogs were cleaned of false detections, background galaxies, or stars with bad measurements by applying both positional and photometric quality cuts. Stars that fell in the gap between the two ACS chips or near the edges of the array were removed because dithering caused these areas to have lower exposure time and therefore more noise. Detections near bright stars were also removed because diffraction spikes tend to cause false detections.
We corrected our photometry for CTE losses following the prescription of Riess & Mack (2004) and then converted instrumental magnitudes into the Johnson-Cousins system following the procedure outlined in Sirianni et al. (2005). Our final catalogs contain 369 213 objects with a measured magnitude in both V and I in the case of NGC 1569 and 402 136 stars in the case of NGC 4449.
3. Stellar population gradients
3.1. CMD morphology and foreground contamination
The innermost ACS CMDs (top left panel in Figs. 6 and 7) show all the evolutionary features expected at the magnitudes sampled by our data: a blue plume consisting of MS stars and blue loop stars at the blue end of their loops, a red plume consisting of red supergiants and oxygen-rich asymptotic giant branch (AGB) stars, blue loop stars on tracks that cross between the two plumes, a horizontal finger of carbon stars extending redward from the tip of the RGB (TRGB), and a prominent RGB extending from its tip to the faintest detectable magnitudes. The first three features are due primarily to young stars ( ≲ 108.5 yr), whereas the latter two are primarily due to intermediate-age and old stars ( ≳ 108.5 yr).
The starbursts in NGC 1569 and NGC 4449 are concentrated toward the galaxy centers. The outermost ACS field of NGC 1569 (10885/A5) shows evidence only for the oldest CMD features of the RGB and carbon stars. These are also the dominant features in the outermost ACS field of NGC 4449 (10585/A4). However, that field still shows a small blue plume due to younger stars at V − I ≈ 0. This is the outer tail of the younger stars in the main body of NGC 4449, as quantified by the analysis of the spatial dependence of the stellar populations in Annibali et al. (2008, their Figs. 8 and 19). No evidence of young CMD features is present in any of the large-radii WFPC2 fields that form the primary focus of the present study. We have not attempted to set rigorous limits on any small amounts of young stars at large radii, but no such stars are needed to explain the features evident in the data.
The NGC 1569 WFPC2 CMDs show a red giant branch of stars with colors (V − I) in the ≈1.5−2.5 range and a tip at I ≈ 24.5, a red tail of carbon stars extending above and to the right of the TRGB (2.4 ≤ V − I ≤ 4.0, 23.4 ≤ I ≤ 24.4) mixed with a strip of foreground stars located between approximately V − I = 1.5, I = 18 and V − I = 4, I = 25. In the case of NGC 4449, the red giant branch of stars has colors (V − I) in the 0.75 − 1.75 range and a tip at I ≈ 24.0 and the carbon stars are located approximately in the 1.75 ≤ V − I ≤ 3.0, 23.0 ≤ I ≤ 24.0 region.
NGC 1569 is located close to the Galactic plane (b = 11.24°), therefore our fields suffer from significant foreground contamination. The contrast of this foreground population with respect to the stars in the target galaxy increases as one moves further out in the halo. To quantitatively model the foreground population we used the Besancon models of stellar population synthesis of the Milky Way Galaxy (Robin et al. 2003). We generated synthetic CMDs for each of the fields to see how well they match our observational data (see example in Fig. 8). The simulation results fit the observational CMDs quite well when it comes to the location of foreground stars on the CMDs but they fail to agree in the exact number of counts. The predicted number of stars is ~30% higher than the number of foreground stars we observe in each field. This is, however, to be expected as the model is less accurate for low galactic latitudes and does not account for highly or irregularly absorbing clouds.
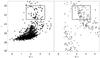 |
Fig. 8 NGC 1569 CMD for field 10885/1 (left) and the Besancon model predictions for foreground population for the same field (right). The boxes indicate a region populated exclusively by foreground stars that was used to calculate the foreground scaling factor (see 3.4). |
For NGC 4449 (b = 72.40°) the Galactic foreground contamination is negligible. The Besancon model predicts about six stars per square arcminute down to I = 28 mag.
3.2. TRGB magnitude
The absolute I-band magnitude of the TRGB is approximately a standard candle, with MI = −4.0 ± 0.1 (Bellazzini et al. 2004; Barker et al. 2004). For ages > 2 Gyr and metallicities (Z) ≲ 0.25 Z⊙ there is little variation in the MI with age or Z. Therefore, the observed TRGB magnitude is primarily an indicator of distance, with reddening also playing a role.
Grocholski et al. (in prep.) and Annibali et al. (2008) found the TRGB apparent I-band magnitudes for NGC 1569 and NGC 4449 to be 24.47 ± 0.04 and 24.02 ± 0.05, respectively. Following the approach of the previous authors we calculate the TRGB magnitude for each of our WFPC2 fields using the method developed by van der Marel and described in detail in Cioni et al. (2000). For NGC 4449, both of our fields excellently agree with the Annibali et al. (2008) results, with an average of ITRGB = 24.06 ± 0.07. In NGC 1569, we find some variation between the TRGB brightness in each of our four fields, which could be caused by a difference in distance or reddening amongst the fields. At the distance of NGC 1569, our outermost field has a projected distance of 6.35 kpc. If we assume a thin disk geometry that is inclined 45o with respect to the line-of-sight, the difference in brightness between the TRGB in the outermost field and in the galactic center is ~0.005 mag. This is well below our photometric detection limits, therefore suggesting that reddening may be responsible for differences in the TRGB brightnesses.
The foreground extinction maps of Schlegel et al. (1998) have a resolution of 6.1 arcmin and therefore provide insight into variations in foreground extinction between our fields. In general, we find little variation within each galaxy, with E(V − I) varying by less than ± 0.02 mag for three of the NGC 1569 fields and by less than ± 0.001 mag for both of the NGC 4449 fields. This is well within the error bars of the measurements and can therefore be safely ignored. The only exception is field 10885/1, which has an E(V − I) that is 0.15 mag higher than the other NGC 1569 fields. We therefore correct for this differential reddening in all measurements of the 10885/1 field throughout the remainder of this paper to enable a fair comparison with the results of the other fields.
When we correct our TRGB measurement in the 10885/1 field for the differential reddening, we find the average of all four NGC 1569 fields is ITRGB = 24.47 ± 0.02, which excellently agrees with previous results. This agreement provides a useful consistency check on the photometric calibration, RGB identification, and reddening estimates for our WFPC2 fields. The individual TRGB determinations are shown as horizontal dot-dashed lines in Figs. 6 and 7.
3.3. RGB color
Age and metallicity gradients.
In order to explore stellar population properties as a function of distance from the galaxy center we used the WFPC2 fields together with the ACS subfields shown in Figs. 1 and 2. The WFPC2 fields for NGC 4449 lie on the same side of the galaxy, so we chose the ACS subfields along the diagonal of the ACS image that points roughly toward the WFPC2 fields. The WFPC2 fields for NGC 1569 are distributed azimuthally around the galaxy, and we chose the ACS subfields somewhat arbitrarily to lie along the direction toward the top left of the ACS image.
To estimate the RGB color, boxes of stars with 1.60 ≤ V − I ≤ 2.40, 24.4 ≤ I ≤ 25.4 (NGC 1569) and 0.75 ≤ V − I ≤ 1.75, 24.0 ≤ I ≤ 25.0 (NGC 4449) were extracted (see Figs. 6 and 7). The stars were then binned according to color and a Gaussian was fitted to the color distribution. Its peak was taken as an estimate of the average RGB color and its width divided by the square root of the number of stars as an estimate of the error. All RGB counts were corrected for the incompleteness determined as in Sect. 2.7. The results are shown as function of elliptical radius in Fig. 9.
Near the center of the galaxies the RGB colors are difficult to interpret for two reasons. First, the presence of blue loop stars contaminates the blue side of the RGB, which leads to a color that might be biased on the blue side of the true color (as discussed in Annibali et al. 2008). Second, there is significant and variable extinction present intrinsic to the target galaxy, as evidenced by patchy dust obscuration (see e.g. Kobulnicky & Skillman 1997). This may lead to an RGB color that is biased on the red side of the true color. Specifically, the central dip in the NGC 4449 profile is likely caused by the first effect. For these reasons we do not interpret the RGB colors in the central 2.5 arcmin of each galaxy.
For both galaxies, the color stays relatively constant but with some up and down variations that exceed the uncertainties in the photometry. To quantify this we performed a straight-line fit to the data outside of 2.5 arcmin. We cast the fit in the form c = A + B·(m − ⟨ m ⟩ ), where ⟨ m ⟩ is the average m of the fields (both in kpc), c is the color, and A and B are the average RGB color and color gradient per kpc, respectively. There are usually two methods to set the weights in linear fits, one based on the known random uncertainties in the data points, and the other based on the rms of the points around the best fit. In our analysis we used the higher of these two values. This ensures that any unknown systematic uncertainties are accounted for in the error bars we derive on A and B. The best fits together with their error ranges are shown in Fig. 9. For both galaxies the data are consistent with zero RGB color gradient outside 2.5 arcmin, with the maximum allowed gradients being –0.002 or +0.012 mag/kpc for NGC 1569, and –0.017 or +0.025 mag/kpc for NGC 4449.
The RGB color is a highly degenerate indicator of stellar population properties, depending on extinction, metallicity, and age. The goal of the present analysis is, therefore, to search for relative population gradients and not absolute population properties. Nonetheless, it is useful to briefly asses the populations that may be consistent with the observed color. For this we use the stellar population synthesis model predictions of Girardi et al. (2002). For NGC 1569 we use the foreground extinction E(V − I) = 0.60 from Burstein & Heiles (1984) (see the discussion in Grocholski et al. 2008) and for NGC 4449 we use the foreground extinction E(V − I) = 0.019 from Schlegel et al. (1998). We assume that the internal galaxy extinction is negligible beyond 2.5 arcmin.
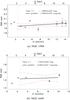 |
Fig. 9 RGB color variation as a function of elliptical radius m from the galaxy center. ACS data points are shown as diamonds and WFPC2 data points as asterisks. The measured colors shown here are not corrected for foreground or (possible) internal extinction. Best fits are shown as solid lines and their error ranges are indicated by long-dashed lines. |
Table 2 shows what the measured RGB color implies for the metallicity Z if one assumes either age =3 Gyr or 10 Gyr. This can be compared to the metallicities of the gas in the central region, which are Z ≈ 0.005 and 0.006 for NGC 1569 and NGC 4449 (see, e.g. Greggio et al. 1998; and Annibali et al. 2008, and references therein). Regardless of the assumed age, the stellar metallicities found from analyzing the RGB colors are lower than the gas metallicities in each galaxy. This was to be expected, because the gas has likely been metal-enriched through recent star formation.
Using these results we estimated Z gradients at fixed age and age gradients at fixed Z (see again Table 2). The large error bars mean that the results provide only an upper limit to any gradient that may be present intrinsically.
3.4. Carbon star counts
Another CMD feature that allows the study of radial gradients in old populations is the red tail of carbon stars. A unique identification of carbon stars requires spectra but as an approximation we can select stars from the CMD using the region that is believed to be predominantly composed of carbon stars (see e.g. Marigo et al. 2003).
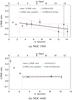 |
Fig. 10 C/RGB stars ratio as a function of elliptical radius m from the galaxy center. ACS data points are shown as diamonds and WFPC2 data points as asterisks. Best straight line fits are shown as solid lines and their error ranges are indicated by long-dashed lines. |
To obtain the estimate of the number of carbon stars in NGC 1569 we first determined a foreground scaling factor by counting stars in a CMD region that contains only foreground stars (see Fig. 8) in both the data and the Besancon model and dividing the former by the latter. Then, we subtracted from the data the foreground model predictions multiplied by this scaling factor.
Carbon stars were selected at 2.40 ≤ V − I ≤ 3.85, 23.4 ≤ I ≤ 24.4 (NGC 1569) and 1.75 ≤ V − I ≤ 3.0, 23.0 ≤ I ≤ 24.0 (NGC 4449). The color limit was chosen to avoid a significant contribution of RGB and oxygen-rich AGB stars (Annibali et al. 2008). The chosen ranges are depicted as boxes in the middle left panel of Fig. 6 and the bottom left panel of Fig. 7. Figure 10 shows the results as a function of elliptical radius. The same completeness corrections were applied as for the RGB color. For simplicity, we refer to the ratio of the counts in the CMD boxes as the C/RGB ratio. However, it should be kept in mind that no attempt was made to to uniquely classify the stars in the chosen boxes.
Using the C/RGB ratio as an absolute indicator of stellar population properties is difficult for several reasons. For example, the number of carbon stars depends on the lifetime of the thermally-pulsating (TP) AGB phase, which is only poorly known. Also, many carbon stars could be dust enshrouded and unseen in the I-band; see e.g. Boyer et al. (2009), who have revealed that up to 40% of AGB stars may be missing from optical CMDs. However, the C/RGB ratio can again be used as an indicator of relative population gradients. In any stellar population model the number of TP-AGB and carbon stars tends to decrease compared to the number of RGB stars with increasing population age (e.g. Thuan & Izotov 2005). Therefore, gradients in the C/RGB ratio might be indicative of age gradients.
As before, we do not interpret the results inside 2.5 arcmin, because the “RGB box” in the CMD may be contaminated by younger stars that are not actually on the RGB. Outside of the central 2.5 arcmin the observed gradients are very shallow. The straight line fits in the figures show that both galaxies are consistent with zero gradient.
4. Density profiles
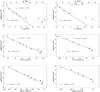 |
Fig. 11 NGC 1569 (left) and NGC 4449 (right) density profiles as a function of m (top), m1/4 (middle) and log(m) (bottom), where m is the elliptical radius from the galaxy center. N is the number of stars in the RGB boxes shown in Figs. 6 and 7. The fits fixed to the ACS data points (top) and all points (middle and bottom) are shown as solid lines. The symbol types are the same as in Figs. 9 and 10. The dotted lines show disk scale lengths Rd (upper panels) and effective radii Re (middle panels). |
4.1. RGB counts
Observational evidence indicates that different types of systems follow different density profiles. For example, the metal-weak halo of the Milky Way follows a roughly power-law density profile: ρ ~ r-2.8 (Jurić et al. 2008). Elliptical galaxies tend to have profiles to large radii that resemble the de Vaucouleurs law: surface brightness is linear with r1/4 (Schade et al. 1999). Spiral galaxy disks tend to have an exponential fall-off with radius: their surface brightness is linear with r (and they often have a truncation at some radius; e.g. de Jong et al. 2007). These different profiles are straight lines in plots of log density versus either log (m), m1/4 or m, where m is the elliptical radius.
Because we are interested in understanding to what kind of population our stars belong, we study their density profiles using the number density of RGB stars at different radii. To do this, we use the same boxes and completeness corrections as we did to study the RGB color. In Fig. 11 we plot the density profiles of NGC 1569 (left) and NGC 4449 (right) as a function of the elliptical radius, m (top), as well as m1/4 (middle) and log(m) (bottom). The equation for the best straight line fits are given, with the fit overplotted on the data. For the exponential fits, the disk scale lengths, Rd, are given and Re, the effective radii, are indicated for the m1/4 fits.
The values of Rd quoted in the figures are higher than the ones previously given in the literature (0.385′ for NGC 1569 (Willett et al. 2005) and 0.763′ for NGC 4449 (Hunter et al. 2005), both converted from values in kpc using the distances adopted by the authors). This is presumably because previous authors measured integrated light in the optical, where one is sensitive to young stars that are more concentrated toward the galaxy center than the RGB stars studied here.
For both galaxies the star counts appear to be fitted reasonably well with the de Vaucouleurs and power-law profiles (middle and bottom panel of Fig. 11, respectively). The log(N) vs. m plots (Fig. 11, top panel) show that the number of stars at large galactocentric distances is higher than a simple exponential model would predict. This suggests that the stars we see at large radii are not just the extrapolation of an inner exponential disk. Instead, they are probably part of a spheroidal stellar halo component.
While in principle we are able to fit a double exponential to the data (see Fig. 12), this does not mean that a thick disk is the favored explanation of the elevated density we see at large radii. Many of our fields are well away from the projected major axis, and in view of this a rounder component, i.e. a halo, seems more plausible.
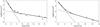 |
Fig. 12 Double exponential fits (solid lines) to the data, with their single exponential components (dashed lines) indicated (NGC 1569 on the left and NGC 4449 on the right). |
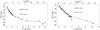 |
Fig. 13 Comparison of surface brightness profiles from 2MASS K-band images with our RGB star counts for NGC 1569 (left) and NGC 4449 (right). A vertical shift was applied to the RGB profiles to line the profiles up. |
4.2. Integrated light profiles
In order to perform a consistency check, we determined the profiles of integrated light from 2MASS K-band images for comparison to our RGB counts. K is the reddest band in the 2MASS survey, and is most dominated by light from RGB stars. Because intensity is linearly proportional to the number of stars, one would expect the RGB count profiles in Fig. 11 to match the measured 2MASS surface brightness profiles after applying a vertical shift.
The intensities at different major axis radii were calculated from the 2MASS images using the IRAF2 task ellipse, with the ellipticity, PA and axial ratio values fixed to values typical at 2 arcmin radii (see Table 1). The calibrated 2MASS magnitudes were then obtained by applying the following formula: mag = MAGZP − 2.5 log 10(S), where the S is the integrated, background-subtracted flux in “DN” (data numbers) and MAGZP is the zeropoint obtained from the image header. We truncated the profiles at ~0.4% of the sky value, the same as the value adopted for profiles published in the 2MASS Large Galaxy Atlas at http://irsa.ipac.caltech.edu/.
As can be seen in Fig. 13, the resulting profiles line up continuously with the shifted RGB-count profiles, which was to be expected since K-band measures mostly light from RGB stars. This also confirms that individual star counts are an excellent way of following density profiles to large radii, where the integrated light falls well below the sky background and becomes hard to quantify.
5. Discussion and conclusions
We obtained and analyzed HST/WFPC2 images of several fields in the outer halos of the nearby starburst galaxies NGC 1569 and NGC 4449. The fields were imaged using the F606W and F814W filters. We reduced the data and performed point source photometry to obtain CMDs of I vs. V − I. We used these CMDs to perform a study of stellar population and density gradients in these galaxies. To maximize the radial range available for analysis, we included in our study also the CMDs (in the same bands) derived from our prior HST/ACS photometry near the galaxy centers. Corrections for foreground contamination, incompleteness, and differential dust extinction were calculated and applied as necessary.
The HST/WFPC2 fields in our study are located roughly between 5 and 8 scale radii (exponential disk scale radius or effective radius) from the galaxy centers. The corresponding elliptical (isophotal or major axis) radii fall between 7 and 14 scale radii. Despite these significant radii, we detect stars belonging to these galaxies in all the fields. This implies that the galaxies have faint outer stellar envelopes, and are not tidally truncated within the range of radii addressed by our study. Similar results have been obtained for other star-forming dwarfs, see, e.g. the recent work by Noël & Gallart (2007), Tikhonov (2006b), Alonso-García et al. (2006).
The CMDs of the HST/WFPC2 fields imply that the stars fall predominantly in the evolutionary sequences of the RGB and the TP-AGB (carbon star) phases. These phases correspond to stars of intermediate and old ages (in excess of a few hundred Myr). Although younger stars on the main sequence, blue loop, and red supergiant phases are present in abundance near the centers of these starburst galaxies, they are not seen in the outer HST/WFPC2 fields. This confirms results from our own previous work on the central regions of these galaxies (Grocholski et al. 2008; Annibali et al. 2008), as well as from studies of other galaxies in the literature (e.g. Tosi et al. 2001; Tolstoy et al. 2009), that the starburst phenomenon tends to be strongly concentrated toward the galaxy center. The presence of older stars at all radii indicates that the starbursts occurred in pre-existing galaxies with prior star formation, and were not the first star-formation episodes in an otherwise primordial gas cloud.
We identified and quantified the TRGB magnitude in all HST/WFPC2 fields. The average WFPC2 TRGB magnitudes (not corrected for foreground extinction) are 24.47 ± 0.02 (NGC 1569) and 24.06 ± 0.07 (NGC 4449). These values excellently agree with the results obtained from our previously analyzed HST/ACS data: 24.47 ± 0.04 (NGC 1569; Grocholski et al. 2008) and 24.02 ± 0.05 (NGC 4449; Annibali et al. 2008), respectively. The new TRGB results therefore support the galaxy distances derived in these previous studies.
To study the origin and characteristics of the intermediate-age/old outer stellar envelopes of the sample galaxies (outside the central starburst), we measured the observed radial profiles of the RGB color and the number ratio of carbon to RGB stars. Gradients in these quantities would be tell-tale signs of radial gradients in either the age or metallicity of the population. However, to within the uncertainties of our analysis, no gradients are detected (the maximum allowed gradients are –0.002 or +0.012 mag/kpc for NGC 1569, and –0.017 or +0.025 mag/kpc for NGC 4449). This does not mean that no gradients exist, but merely that better data would be needed to detect any gradients that might exist.
We measured the density profiles of RGB stars over the radial range accessible to our study. At small radii we show that the profiles are consistent with 2MASS measurements of near-IR integrated light. The profiles were fitted with exponential, de Vaucouleurs, and power-law models. While the latter profiles provide acceptable fits, exponential profiles do not. Both galaxies have an excess of stars at large radii above what a simple exponential model would predict. This indicates that the intermediate-age/old stars at large radii at not merely the outer part of an exponential disk. Instead, the observed density profiles are more typical for an extended stellar halo. Such halos are believed to be a common byproduct of hierarchical formation (but see also Stinson et al. 2009, for a discussion on how such halos can be formed in isolated galaxies, i.e. without external perturbations). Stellar halos have been found in all dwarf galaxies studied to a sufficient depth (see Stinson et al. 2009, and the extensive reference list therein). Our study shows that NGC 1569 and NGC 4449 have similar halos to those seen in other galaxies of similar morphology as well as that deep resolved stellar photometry enables one to distinguish between the profiles of the halos and the profiles of the star-forming disks they contain.
For all calculations in the present paper we use an improved photometric catalog based on a reanalysis of the data presented in Grocholski et al. (2008).
IRAF is distributed by the National Optical Astronomy Observatory, which is operated by the Association of Universities for Research in Astronomy (AURA) under cooperative agreement with the National Science Foundation.
Acknowledgments
A.R. would like to thank Jennifer Mack for the help with the WFPC2 data reduction. We thank Luca Angeretti, Laura Greggio, Enrico V. Held, Claus Leitherer, Donatella Romano, Marco Sirianni and Monica Tosi for their collaboration on other parts of the HST projects GO-10585 and GO-10885. We also want to thank the anonymous referee for his/her constructive comments that helped improve the manuscript.
Support for proposals GO-10585 and GO-10885 was provided by NASA through grants from STScI, which is operated by AURA, Inc., under NASA contract NAS 5-26555.
This publication makes use of data products from the Two Micron All Sky Survey, which is a joint project of the University of Massachusetts and the Infrared Processing and Analysis Center/California Institute of Technology, funded by the National Aeronautics and Space Administration and the National Science Foundation.
References
- Aloisi, A., Clampin, M., Diolaiti, E., et al. 2001, AJ, 121, 1425 [NASA ADS] [CrossRef] [Google Scholar]
- Alonso-García, J., Mateo, M., & Aparicio, A. 2006, PASP, 118, 580 [NASA ADS] [CrossRef] [Google Scholar]
- Angeretti, L., Tosi, M., Greggio, L., et al. 2005, AJ, 129, 2203 [NASA ADS] [CrossRef] [Google Scholar]
- Annibali, F., Aloisi, A., Mack, J., et al. 2008, AJ, 135, 1900 [NASA ADS] [CrossRef] [Google Scholar]
- Barker, M. K., Sarajedini, A., & Harris, J. 2004, ApJ, 606, 869 [NASA ADS] [CrossRef] [Google Scholar]
- Bekki, K. 2008, ApJ, 680, L29 [NASA ADS] [CrossRef] [Google Scholar]
- Bellazzini, M., Ferraro, F. R., Sollima, A., Pancino, E., & Origlia, L. 2004, A&A, 424, 199 [NASA ADS] [CrossRef] [EDP Sciences] [Google Scholar]
- Blair, W. P., & Fesen, R. A. 1998, in BAAS, 30, 1365 [Google Scholar]
- Boyer, M. L., Skillman, E. D., van Loon, J. T., Gehrz, R. D., & Woodward, C. E. 2009, ApJ, 697, 1993 [NASA ADS] [CrossRef] [Google Scholar]
- Burstein, D., & Heiles, C. 1984, ApJS, 54, 33 [NASA ADS] [CrossRef] [Google Scholar]
- Cioni, M., van der Marel, R. P., Loup, C., & Habing, H. J. 2000, A&A, 359, 601 [NASA ADS] [Google Scholar]
- Cole, S., Aragon-Salamanca, A., Frenk, C. S., Navarro, J. F., & Zepf, S. E. 1994, MNRAS, 271, 781 [NASA ADS] [CrossRef] [Google Scholar]
- Cooper, A. P., Cole, S., Frenk, C. S., et al. 2010, MNRAS, 406, 744 [NASA ADS] [CrossRef] [Google Scholar]
- de Jong, R. S., Seth, A. C., Bell, E. F., et al. 2007, in IAU Symp. 241, ed. A. Vazdekis, & R. F. Peletier, 503 [Google Scholar]
- de Jong, R. S., Radburn-Smith, D. J., & Sick, J. N. 2009, in IAU Symp. 254, ed. J. Andersen, J. Bland-Hawthorn, & B. Nordström, 19 [Google Scholar]
- Dolphin, A. E. 2009, PASP, 121, 655 [NASA ADS] [CrossRef] [Google Scholar]
- Fruchter, A., & Sosey, M. 2009, The MultiDrizzle Handbook, version 3.0 [Google Scholar]
- Fruchter, A. S., Hack, W., Droetboom, M., et al. 2009, in BAAS, 41, 414 [Google Scholar]
- Gelatt, A. E., Hunter, D. A., & Gallagher, J. S. 2001, PASP, 113, 142 [NASA ADS] [CrossRef] [Google Scholar]
- Girardi, L., Bertelli, G., Bressan, A., et al. 2002, A&A, 391, 195 [NASA ADS] [CrossRef] [EDP Sciences] [Google Scholar]
- Grebel, E. K. 1998, Highlights of Astronomy, 11, 125 [Google Scholar]
- Greggio, L., Tosi, M., Clampin, M., et al. 1998, ApJ, 504, 725 [NASA ADS] [CrossRef] [Google Scholar]
- Grocholski, A. J., Aloisi, A., van der Marel, R. P., et al. 2008, ApJ, 686, L79 [NASA ADS] [CrossRef] [Google Scholar]
- Heckman, T. M. 1998, in Origins, ed. C. E. Woodward, J. M. Shull, & H. A. Thronson Jr., ASP Conf. Ser., 148, 127 [Google Scholar]
- Holtzman, J. A., Burrows, C. J., Casertano, S., et al. 1995, PASP, 107, 1065 [NASA ADS] [CrossRef] [Google Scholar]
- Hunter, D. 1997, PASP, 109, 937 [NASA ADS] [CrossRef] [Google Scholar]
- Hunter, D. A., Rubin, V. C., Swaters, R. A., Sparke, L. S., & Levine, S. E. 2005, ApJ, 634, 281 [NASA ADS] [CrossRef] [MathSciNet] [Google Scholar]
- Jurić, M., Ivezić, Ž., Brooks, A., et al. 2008, ApJ, 673, 864 [NASA ADS] [CrossRef] [MathSciNet] [Google Scholar]
- Kobulnicky, H. A., & Skillman, E. D. 1997, ApJ, 489, 636 [NASA ADS] [CrossRef] [Google Scholar]
- Koekemoer, A. M., Fruchter, A. S., Hook, R. N., & Hack, W. 2002, in The 2002 HST Calibration Workshop: Hubble after the Installation of the ACS and the NICMOS Cooling System, ed. S. Arribas, A. Koekemoer, & B. Whitmore, 337 [Google Scholar]
- Marigo, P., Girardi, L., & Chiosi, C. 2003, A&A, 403, 225 [NASA ADS] [CrossRef] [EDP Sciences] [Google Scholar]
- McQuinn, K. B. W., Skillman, E. D., Cannon, J. M., et al. 2010, ApJ, 721, 297 [NASA ADS] [CrossRef] [Google Scholar]
- Noël, N. E. D., & Gallart, C. 2007, ApJ, 665, L23 [NASA ADS] [CrossRef] [MathSciNet] [Google Scholar]
- Riess, A., & Mack, J. 2004, Time Dependence of ACS WFC CTE Corrections for Photometry and Future Predictions, Tech. Rep. [Google Scholar]
- Robin, A. C., Reylé, C., Derrière, S., & Picaud, S. 2003, A&A, 409, 523 [NASA ADS] [CrossRef] [EDP Sciences] [Google Scholar]
- Schade, D., Lilly, S. J., Crampton, D., et al. 1999, ApJ, 525, 31 [NASA ADS] [CrossRef] [Google Scholar]
- Schlegel, D. J., Finkbeiner, D. P., & Davis, M. 1998, ApJ, 500, 525 [NASA ADS] [CrossRef] [Google Scholar]
- Seth, A., de Jong, R., Dalcanton, J., & GHOSTS Team 2007, in IAU Symp. 241, ed. A. Vazdekis, & R. F. Peletier, 523 [Google Scholar]
- Seth, A., De Jong, R., Radburn-Smith, D., & Ferguson, H. 2008, Resolving the Outer Disks and Halos of Nearby Galaxies, ed. H. Jerjen, & B. S. Koribalski, 127 [Google Scholar]
- Sirianni, M., Jee, M. J., Benítez, N., et al. 2005, PASP, 117, 1049 [NASA ADS] [CrossRef] [Google Scholar]
- Stetson, P. B. 1987, PASP, 99, 191 [NASA ADS] [CrossRef] [Google Scholar]
- Stinson, G. S., Dalcanton, J. J., Quinn, T., et al. 2009, MNRAS, 395, 1455 [NASA ADS] [CrossRef] [Google Scholar]
- Thuan, T. X., & Izotov, Y. I. 1999 [arXiv:astro-ph/9902369] [Google Scholar]
- Thuan, T. X., & Izotov, Y. I. 2005, ApJ, 627, 739 [NASA ADS] [CrossRef] [Google Scholar]
- Tikhonov, N. A. 2006a, Astron. Rep., 50, 517 [NASA ADS] [CrossRef] [Google Scholar]
- Tikhonov, N. A. 2006b, Astron. Lett., 32, 149 [NASA ADS] [CrossRef] [Google Scholar]
- Tolstoy, E., Hill, V., & Tosi, M. 2009, ARA&A, 47, 371 [NASA ADS] [CrossRef] [Google Scholar]
- Tosi, M., Greggio, L., Marconi, G., & Focardi, P. 1991, AJ, 102, 951 [NASA ADS] [CrossRef] [Google Scholar]
- Tosi, M., Sabbi, E., Bellazzini, M., et al. 2001, AJ, 122, 1271 [NASA ADS] [CrossRef] [Google Scholar]
- Vansevičius, V., Arimoto, N., Hasegawa, T., et al. 2004, ApJ, 611, L93 [NASA ADS] [CrossRef] [Google Scholar]
- Willett, K. W., Elmegreen, B. G., & Hunter, D. A. 2005, AJ, 129, 2186 [NASA ADS] [CrossRef] [Google Scholar]
- Zolotov, A., Willman, B., Brooks, A. M., et al. 2010, ApJ, 721, 738 [NASA ADS] [CrossRef] [PubMed] [Google Scholar]
All Tables
All Figures
|
Fig. 1 ACS 3-color F658N (Hα), F814W (I) and F606W (V) composite image of NGC 1569 showing the locations of ACS subfields. Owing to the decrease in stellar density in the outer portions of the galaxy, we increased the size of our boxes as we move outward from the center of the galaxy. |
| In the text | |
|
Fig. 2 ACS 4-color F435W (B), F555W (V), F814W (I), and F658N (Hα) composite image of NGC 4449 showing the locations of ACS subfields. See the caption of Fig. 1 for the explanation of different box sizes. |
| In the text | |
|
Fig. 3 Hubble Legacy Archive footprints: ACS and WFPC2 fields (black) for NGC 1569 (left) and NGC 4449 (right) pointings overlaid on Digitized Sky Survey (DSS) images. The fields depicted in light gray come from programs other than those listed in Table 1 and are not discussed in this paper because they do not go deep enough to contribute to our analysis. |
| In the text | |
|
Fig. 4 Drizzled combination of 32 1000/1100 s images for NGC 1569, field 10885/1, F606W, WF3 chip. |
| In the text | |
|
Fig. 5 Distribution of the DAOPHOT parameters σ (top), sharpness (middle), and χ2 (bottom) as a function of F814W VEGAMAG magnitude (a rough approximation of the Johnson-Cousins I) for NGC 1569, field 10885/1. |
| In the text | |
|
Fig. 6 CMDs of the innermost (top left) and outermost ACS (top right) subfield and the four WFPC2 fields (middle and bottom) for NGC 1569. The dashed-dotted lines indicate the calculated TRGB values and the long-dashed lines show 50% completeness levels. The two boxes shown in the 10885/1 plot indicate adopted color and I-magnitude ranges for selecting RGB and carbon stars (see Sects. 3.3, 3.4 and 4.1 for details). Smaller plot symbols are used for the A1 subfield to avoid its saturation and make the different CMD features visible. |
| In the text | |
|
Fig. 7 CMDs of the innermost (top left) and outermost ACS (top right) subfield and the two WFPC2 fields (bottom) for NGC 4449. See the caption of Fig. 6 for further details. |
| In the text | |
|
Fig. 8 NGC 1569 CMD for field 10885/1 (left) and the Besancon model predictions for foreground population for the same field (right). The boxes indicate a region populated exclusively by foreground stars that was used to calculate the foreground scaling factor (see 3.4). |
| In the text | |
|
Fig. 9 RGB color variation as a function of elliptical radius m from the galaxy center. ACS data points are shown as diamonds and WFPC2 data points as asterisks. The measured colors shown here are not corrected for foreground or (possible) internal extinction. Best fits are shown as solid lines and their error ranges are indicated by long-dashed lines. |
| In the text | |
|
Fig. 10 C/RGB stars ratio as a function of elliptical radius m from the galaxy center. ACS data points are shown as diamonds and WFPC2 data points as asterisks. Best straight line fits are shown as solid lines and their error ranges are indicated by long-dashed lines. |
| In the text | |
|
Fig. 11 NGC 1569 (left) and NGC 4449 (right) density profiles as a function of m (top), m1/4 (middle) and log(m) (bottom), where m is the elliptical radius from the galaxy center. N is the number of stars in the RGB boxes shown in Figs. 6 and 7. The fits fixed to the ACS data points (top) and all points (middle and bottom) are shown as solid lines. The symbol types are the same as in Figs. 9 and 10. The dotted lines show disk scale lengths Rd (upper panels) and effective radii Re (middle panels). |
| In the text | |
|
Fig. 12 Double exponential fits (solid lines) to the data, with their single exponential components (dashed lines) indicated (NGC 1569 on the left and NGC 4449 on the right). |
| In the text | |
|
Fig. 13 Comparison of surface brightness profiles from 2MASS K-band images with our RGB star counts for NGC 1569 (left) and NGC 4449 (right). A vertical shift was applied to the RGB profiles to line the profiles up. |
| In the text | |
Current usage metrics show cumulative count of Article Views (full-text article views including HTML views, PDF and ePub downloads, according to the available data) and Abstracts Views on Vision4Press platform.
Data correspond to usage on the plateform after 2015. The current usage metrics is available 48-96 hours after online publication and is updated daily on week days.
Initial download of the metrics may take a while.