Free Access
Fig. 1
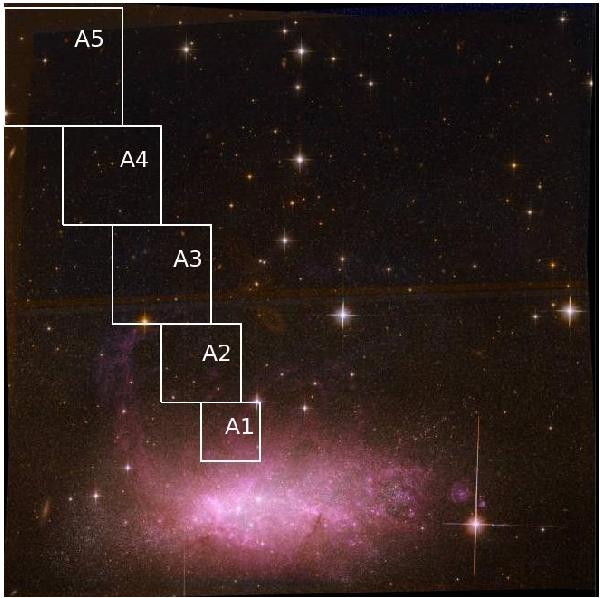
ACS 3-color F658N (Hα), F814W (I) and F606W (V) composite image of NGC 1569 showing the locations of ACS subfields. Owing to the decrease in stellar density in the outer portions of the galaxy, we increased the size of our boxes as we move outward from the center of the galaxy.
Current usage metrics show cumulative count of Article Views (full-text article views including HTML views, PDF and ePub downloads, according to the available data) and Abstracts Views on Vision4Press platform.
Data correspond to usage on the plateform after 2015. The current usage metrics is available 48-96 hours after online publication and is updated daily on week days.
Initial download of the metrics may take a while.