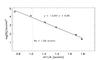
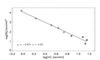
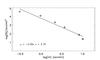
Fig. 11
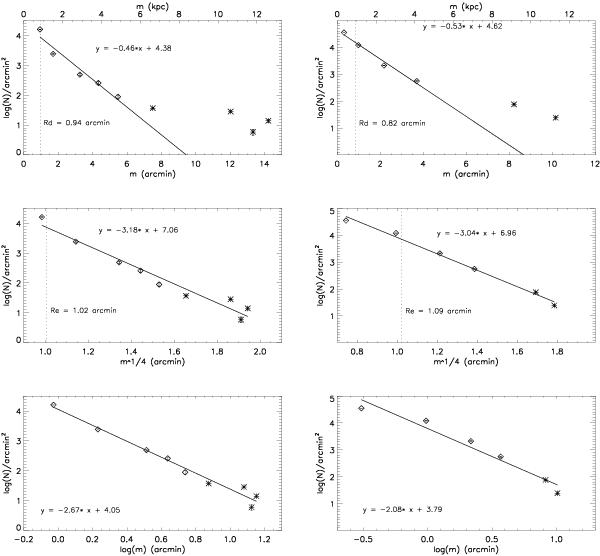
NGC 1569 (left) and NGC 4449 (right) density profiles as a function of m (top), m1/4 (middle) and log(m) (bottom), where m is the elliptical radius from the galaxy center. N is the number of stars in the RGB boxes shown in Figs. 6 and 7. The fits fixed to the ACS data points (top) and all points (middle and bottom) are shown as solid lines. The symbol types are the same as in Figs. 9 and 10. The dotted lines show disk scale lengths Rd (upper panels) and effective radii Re (middle panels).
Current usage metrics show cumulative count of Article Views (full-text article views including HTML views, PDF and ePub downloads, according to the available data) and Abstracts Views on Vision4Press platform.
Data correspond to usage on the plateform after 2015. The current usage metrics is available 48-96 hours after online publication and is updated daily on week days.
Initial download of the metrics may take a while.