Fig. 6
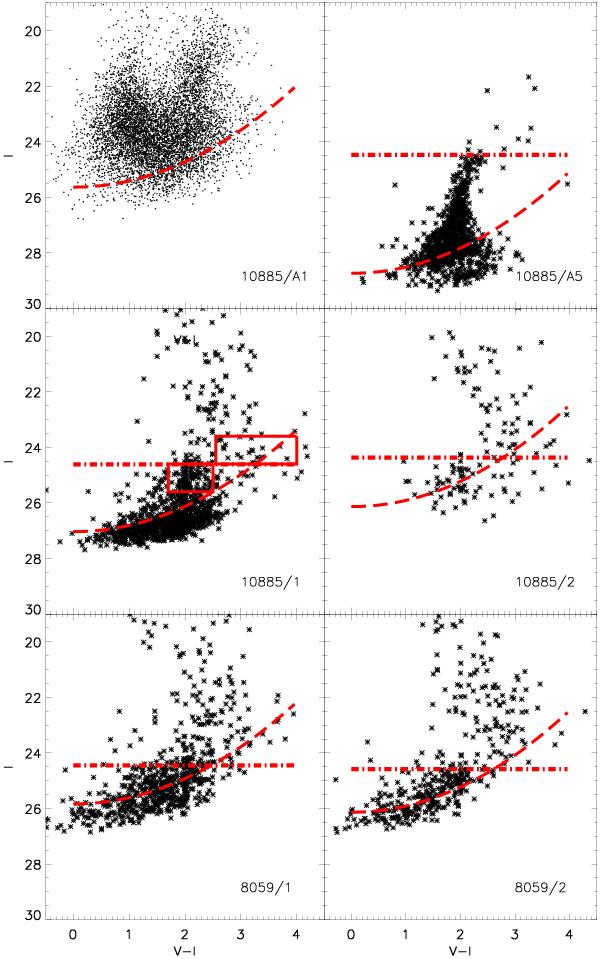
CMDs of the innermost (top left) and outermost ACS (top right) subfield and the four WFPC2 fields (middle and bottom) for NGC 1569. The dashed-dotted lines indicate the calculated TRGB values and the long-dashed lines show 50% completeness levels. The two boxes shown in the 10885/1 plot indicate adopted color and I-magnitude ranges for selecting RGB and carbon stars (see Sects. 3.3, 3.4 and 4.1 for details). Smaller plot symbols are used for the A1 subfield to avoid its saturation and make the different CMD features visible.
Current usage metrics show cumulative count of Article Views (full-text article views including HTML views, PDF and ePub downloads, according to the available data) and Abstracts Views on Vision4Press platform.
Data correspond to usage on the plateform after 2015. The current usage metrics is available 48-96 hours after online publication and is updated daily on week days.
Initial download of the metrics may take a while.