| Issue |
A&A
Volume 530, June 2011
|
|
|---|---|---|
| Article Number | A20 | |
| Number of page(s) | 16 | |
| Section | Extragalactic astronomy | |
| DOI | https://doi.org/10.1051/0004-6361/201015839 | |
| Published online | 29 April 2011 | |
The VIMOS VLT Deep Survey
The contribution of minor mergers to the growth of
LB $\ga$} ≳ LB* galaxies since z ~ 1 from spectroscopically identified pairs⋆
1
Laboratoire d’Astrophysique de Marseille, Pôle de l’Étoile, Site de Château-Gombert, 38 rue Frédéric Joliot-Curie, 13388 Marseille, France
e-mail: This email address is being protected from spambots. You need JavaScript enabled to view it.
2
Institute for Astronomy, University of Edinburgh, Blackford Hill, Edinburgh EH9 3HJ, UK
3
INAF-Osservatorio Astronomico di Bologna, via Ranzani 1, 40127 Bologna, Italy
4 Laboratoire d’Astrophysique de Toulouse-Tarbes, Université de Toulouse, CNRS, 14 Av. E. Belin, 31400, France
5
IASF-INAF, via Bassini 15, 20133 Milano, Italy
6
INAF-Osservatorio Astronomico di Brera, via Brera 28, 20021 Milan, Italy
7
Institut d’Astrophysique de Paris, UMR 7095, 98bis Bd Arago, 75014 Paris, France
8
Observatoire de Paris, LERMA, 61 avenue de l’Observatoire, 75014 Paris, France
9
The Andrzej Soltan Institute for Nuclear Studies, ul. Hoza 69, 00-681 Warszawa, Poland
10
Astronomical Observatory of the Jagiellonian University, ul Orla 171, 30-244 Kraków, Poland
11
Center for Theoretical Physics PAS, Al. Lotnikow 32/46, 02-668 Warsaw, Poland
Received: 29 September 2010
Accepted: 17 February 2011
Abstract
Aims. The role of minor galaxy mergers in galaxy evolution, and in particular to mass assembly, remains an open question. In this work we measure the merger fraction, fm, of  galaxies in the VVDS-Deep spectroscopic survey, and study its dependence on the B-band luminosity ratio the pair galaxies, μ ≡ LB,2/LB,1, focusing on minor mergers with 1/10 ≤ μ < 1/4, and on the rest-frame NUV − r colour of the principal galaxies.
Methods. We use spectroscopic pairs with redshift z ≲ 1 in the VVDS-Deep survey to define kinematical close pairs as those galaxies with a separation on the sky plane 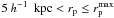 and a relative velocity Δv ≤ 500 km s-1 in redshift space. We vary
  from 30 h-1 kpc to 100 h-1 kpc. We study fm in two redshift intervals and for several values of μ, from 1/2 to 1/10. We take μ ≥ 1/4 and 1/10 ≤ μ < 1/4 as major and minor mergers.
Results. The merger fraction increases with z and its dependence on μ is well described by a power-law function, fm ( ≥ μ) ∝ μs. The value of s evolves from s = −0.60 ± 0.08 at z = 0.8 to s = −1.02 ± 0.13 at z = 0.5. The fraction of minor mergers for bright galaxies shows little evolution with redshift as a power-law (1 + z)m with index m = −0.4 ± 0.7 for the merger fraction and m = −0.5 ± 0.7 for the merger rate, in contrast with the increase in the major merger fraction (m = 1.3 ± 0.5) and rate (m = 1.3 ± 0.6) for the same galaxies. We split our principal galaxies in red and blue, finding that i) fm is higher for red galaxies at every μ, ii)  does not evolve with z, with s = −0.79 ± 0.12 at 0.2 < z < 0.95, and iii)
  evolves dramatically: the major merger fraction of blue galaxies decreases by a factor of three with cosmic time, while the minor merger fraction of blue galaxies is roughly constant.
Conclusions. Our results show that the mass of normal  galaxies has grown by about 25% since z ~ 1 because of the combined effects of minor and major mergers. The relative contribution of the mass growth by merging is ~ 25% due to minor mergers and ~ 75% due to major mergers. The relative effect of merging is more important for red than for blue galaxies, with red galaxies subject to 0.5 minor and 0.7 major mergers since z ~ 1, which leads to a mass growth of ~ 40% and a size increase by a factor of 2. Our results also suggest that, for blue galaxies, minor mergers likely lead to early-type spirals rather than elliptical galaxies. These results show that minor merging is a significant but not dominant mechanism contributing to the mass growth of galaxies in the last ~ 8 Gyr.
Key words: galaxies: evolution / galaxies: formation / galaxies: interactions / galaxies: statistics
Based on data obtained with the European Southern Observatory Very Large Telescope, Paranal, Chile, under Large Programs 070.A-9007 and 177.A-0837. Based on observations obtained with MegaPrime/MegaCam, a joint project of CFHT and CEA/DAPNIA, at the Canada-France-Hawaii Telescope (CFHT) which is operated by the National Research Council (NRC) of Canada, the Institut National des Sciences de l’Univers of the Centre National de la Recherche Scientifique (CNRS) of France, and the University of Hawaii. This work is based in part on data products produced at TERAPIX and the Canadian Astronomy Data Centre as part of the Canada-France-Hawaii Telescope Legacy Survey, a collaborative project of NRC and CNRS.
© ESO, 2011
1. Introduction
As galaxies evolve along cosmic time in the framework of a hierarchical assembly of dark matter haloes, a significant fraction of their accreted mass is expected to come from galaxy-galaxy mergers. The total stellar mass density increases with cosmic time, faster for early-type galaxies (e.g., Drory et al. 2005; Bundy et al. 2005; Arnouts et al. 2007; Ilbert et al. 2010), and galaxy-galaxy merging is a natural physical process to participate to this growth. The role of mergers in galaxy evolution has long been recognised, leading to mass growth and perturbed morphologies, and mergers have been identified as a way to shape elliptical galaxies.
Major mergers, the encounter of two galaxies of comparable masses leading to a fusion, have now been well documented in the nearby as well as in the distant universe. While the fraction of major mergers in the nearby Universe is around 2% (Patton et al. 2000; Patton & Atfield 2008; Darg et al. 2010), it has now been convincingly shown that major mergers were more numerous at redshifts up to z ~ 1 (e.g., Le Fèvre et al. 2000; Patton et al. 2002; Lin et al. 2008; de Ravel et al. 2009; López-Sanjuan et al. 2009b), with the merger rate of bright/massive galaxies staying relatively stable along cosmic time, while the merger rate of intermediate luminosity/mass galaxies was more important in the past (de Ravel et al. 2009). Major mergers have been shown to contribute a significant but not dominant part of the mass growth above the characteristic luminosity L∗, with major mergers being responsible for about 20% of the stellar mass growth (Bundy et al. 2009; Wild et al. 2009; de Ravel et al. 2009; López-Sanjuan et al. 2010b).
As major mergers are apparently not the most important contributor to the mass growth since z ~ 1 other mechanisms must be responsible. Secular processes such as steady cold accretion (Genel et al. 2010, and references therein) or other mass accretion processes like minor mergers must drive this transformation. The merging of smaller galaxies with a more massive one, the minor merger process, is a possible way to increase the mass of galaxies as minor mergers, if frequent, could lead to a significant mass increase. Indirect evidence for minor merging has been presented in the recent literature, including recent star formation in early-type galaxies being compatible with a minor merger origin (Kaviraj et al. 2007, 2009; Fernández-Ontiveros et al. 2011), as confirmed by simulations (Mihos & Hernquist 1994; Bournaud et al. 2007).
However, until now only a few attempts to study the minor merger rate in the local Universe or beyond have been published. Unfortunately, to our knowledge, there are no references to the minor merger rate in local galaxies. At higher redshifts, Lotz et al. (2008) and Jogee et al. (2009) use distortions in galaxy morphologies to infer that the combined major and minor merger fraction is nearly constant since z ~ 1. On the other hand, López-Sanjuan et al. (2010a) estimates that the major and minor merger rate is ~ 1.7 times the major rate for log (M ⋆ /M⊙) ≥ 10 galaxies in GOODS-S at 0.2 < z < 1.1 from their spectro-photometric catalogue.
Here we report the results from the first measurement of the minor merger fraction and rate using kinematically confirmed close pairs. We use the VVDS-Deep spectroscopic redshift survey which offers a unique combination of deep spectroscopy (IAB ≤ 24) to identify faint merging companions, and a wide area (0.5 deg2) which contains enough bright galaxies for a statistically robust analysis.
This paper is organized as follows. In Sect. 2 we summarize the second epoch VVDS-Deep survey data set, while in Sect. 3 the methodology and weight scheme to obtain the merger fraction by close pair statistics and its extension to the regime of minor companions. In Sect. 4 we measure the merger fraction as a function of the redshift and the luminosity ratio between the galaxies in pairs, while in Sect. 5 we study the merger fraction of red and blue galaxies. We estimate the minor merger rate of bright galaxies in Sect. 6, and we discuss the implications of our results in Sect. 7. Finally, we present our conclusions in Sect. 8. We use H0 = 100 h km s-1 Mpc-1, h = 0.7, ΩM = 0.3, and ΩΛ = 0.7 throughout. AB magnitudes are used throughout.
2. VVDS-Deep sample
The VVDS-Deep sample1 (Le Fèvre et al. 2005b) is magnitude selected with 17.5 ≤ IAB ≤ 24. The spectroscopic survey has been conducted on the 0224-04 field with the VIMOS multi-slit spectrograph on the VLT (Le Fèvre et al. 2003), with 4 h integration using the LRRED grism at a spectral resolution R ~ 230. The multi-slit data processing has been performed using the VIPGI package (Scodeggio et al. 2005). Redshift measurement has followed a rigorous approach, with initial guesses based on cross-correlation with reference templates at the same redshift, followed by careful visual inspection by two team members before assigning the redshifts. The final redshifts and quality flags follow a statistically well defined behaviour, leading to a survey for which at least 80% of the sample has a secure redshift. This comprises sources with quality flag = 4 (99% secure), 3 (95% secure), 2 (80% secure) and 9 (those with only a single secure spectral feature in emission in their spectrum). The accuracy in the redshift measurement is 276 km s-1.
Deep photometry is available in this field from a first campaign with the CFH12K camera (Le Fèvre et al. 2004; and McCracken et al. 2003), followed by very deep observations with the CFHTLS survey. Using photometric redshifts (Ilbert et al. 2006), we show that for the galaxies comprising the 20% incompleteness, about 10% have a tentative (quality flag = 1) spectroscopic redshift which is correct for 50% of them, the other 10% have wrong or unknown spectroscopic redshifts, but we use photometric redshift estimates to fully understand the survey completeness as a function of magnitude, type, and redshift.
A total of 8359 galaxies with 0 < zspec ≤ 1.2 and 17.5 ≤ IAB ≤ 24 (primary objects with flags = 1,2,3,4,9; and secondary objects, those that lie by chance in the slits, with flags = 21, 22, 23, 24, 29) from second epoch VVDS-Deep data (Le Fèvre et al., in prep.) have been used in this paper. Note that we have used flag = 1 sources, which are 50% secure and that have not been used in previous VVDS-Deep articles, thanks to the improved weighting scheme in VVDS-Deep (see Sect. 3.1, for details).
3. Statistics of minor close companions in spectroscopic samples
In this section we review the commonly used methodology for computing major merger fractions by close pair statistics in spectroscopic samples, and we extend it to search for minor (i.e., faint) companions in the VVDS-Deep.
The distance between two sources can be measured as a function of their projected separation, rp = θdA(zi), and their rest-frame relative velocity along the line of sight, Δv = c | zj − zi | /(1 + zi), where zi and zj are the redshift of the principal (more luminous galaxy in the pair) and the companion galaxy, respectively; θ is the angular separation, in arcsec, of the two galaxies on the sky plane; and dA(z) is the angular scale, in kpc/arcsec, at redshift z. Two galaxies are defined as a close pair if  and Δv ≤ Δvmax. The inner limit in rp is imposed to avoid spatial resolution limitations due to the size of the observed point spread function. Reasonable limits for ground-based data are
  kpc,
kpc,  kpc, and Δvmax = 500 km s-1. With these constraints, it is expected that 50–70% of the selected close pairs will finally merge (Patton et al. 2000; Patton & Atfield 2008; Lin et al. 2004, 2010; Bell et al. 2006). We used Δvmax = 500 km s-1, kpc, and varied the value of from 30 h-1 kpc to 100 h-1 kpc to study the dependence of the merger fraction with the surrounding volume.
 |
Fig. 1 B-band absolute magnitude versus redshift for all the VVDS-Deep sources with zspec ≤ 1.2. Vertical solid lines identify the redshift intervals in our study, named zr,1 = [0.2,0.65) and zr,2 = [0.65,0.95). The horizontal solid line represents the selection of the principal galaxy sample, MB,1 ≤ −20 − 1.1z. The dashed line shows the limit of the companion sample down to μ ≥ 1/10, MB,2 ≤ − 17.5 − 1.1z, while the dash-dotted line shows that we are complete in both redshift bins when we search for μ ≥ 1/5 companions, MB,2 ≤ − 18.25 − 1.1z. (A colour version of this plot is available in electronic form.) |
We select principal galaxies as defined below and we look for companion galaxies that fulfill the close pair criterion for each galaxy of the principal sample. If one principal galaxy has more than one close companion, we take each possible pair separately (i.e., for the close galaxies A, B, and C, we study the pairs A-B, B-C, and A-C as independent). In addition, we impose a rest-frame B-band luminosity difference between the pair members. We denote the ratio between the luminosity of the principal galaxy, LB,1, and the companion galaxy, LB,2, as  (1)and looked for those systems with LB,2 ≥ μLB,1 or, equivalently, MB,2 − MB,1 ≤ ΔMB = −2.5log μ, where MB,1 and MB,2 are the B-band absolute magnitudes of the principal and companion galaxy in the pair, respectively. We define as major companions those close pairs with μ ≥ 1/4, while minor companions those with 1/10 ≤ μ < 1/4.
We aimed to reach the minor companion regime, i.e., μ = 1/10 (ΔMB = 2.5). For this, we define our principal galaxy sample and companions, and redshift ranges, to preserve statistical robustness and to minimize completeness corrections (see next section). We select as principal galaxies those with  (e.g., Ilbert et al. 2005), where
  and the constant Q = 1.1 accounts for the evolution of the luminosity function in VVDS-Deep survey (Ilbert et al. 2005). With this limit, companions with μ down to 1/10 will be included in the VVDS-Deep sample (Fig. 1). Thanks to the wide area of VVDS-Deep, we have 1011 principal galaxies at 0.1 < z < 1.0. To study minor companions we define as companion galaxies those with
  , and impose different luminosity ratios, μ ≥ 1/2, 1/3, 1/4, 1/5, 1/6, 1/7, 1/8, and 1/10 (ΔMB = 0.75, 1.2, 1.5, 1.75, 1.95, 2.1, 2.25, and 2.5, respectively). We define two redshift bins, named zr,1 = [0.2,0.65) and zr,2 = [0.65,0.95). In these bins, the mean redshifts of the principal galaxies, weighted to take into account their spectroscopic completeness (see next section for details), are
  and
and  . In the former we are complete for μ ≥ 1/10 companions, while in the latter we reach μ ≥ 1/5 (Fig. 1), therefore requiring a completeness correction for 1/10 ≤ μ < 1/5 companions (Sect. 3.1). We are able to reach this faint companions regime due to the depth of the VVDS-Deep spectroscopy (IAB ≤ 24). The number of principal galaxies is n1 = 351 at zr,1 and n2 = 544 at zr,2, this is, n2/n1 = 1.55. On the other hand, the ratio between the probed cosmological volumes is V2/V1 = 1.52, so the number density of principal galaxies is similar in both ranges. Using the group catalog from the VVDS-Deep second-epoch data presented in Cucciati et al. (2010)2 we find that 14%/13% of principal galaxies at zr,1/zr,2 are in a group with three or more members. Hence, also the environment of our principal galaxies is similar in both ranges under study.
If we find Np close pairs in our sample for a given luminosity ratio μ, the merger fraction is  (2)where N1 is the number of galaxies in the principal sample. With this definition the merger fraction is cumulative when μ decreases. This simple definition is valid for volume-limited samples, while we work with spectroscopic, luminosity-limited samples. Because of this, we must take into account the different selection effects in our computation of the merger fraction.
3.1. Accounting for selection effects
Following de Ravel et al. (2009), we correct for three basic selection effects:
-
1.
the limiting magnitude IAB = 24 which imposes a loss of faintcompanions;
-
2.
the spatial sampling rate and the spectroscopic success rate in measuring redshifts;
-
3.
the loss of pairs at small separations because of the ground based seeing limitation of the observations.
The spectroscopic targets have been selected on the basis of the magnitude criterion 17.5 ≤ IAB ≤ 24. Therefore, we miss companions of the principal galaxies which have an absolute magnitude fainter than imposed by the IAB = 24 cut off and the ΔMB magnitude difference, artificially lowering the number of pairs. To take this into account we compute for each observed pair a weight  using the ratio between the co-moving number densities above and below the magnitude cut off (Patton et al. 2000):
  (3)where MB,lim(z) is the limiting magnitude of the catalogue at redshift z,
  is the lower luminosity of a close companion of the principal galaxy in the pair k, and Φ (MB,z) is the luminosity function in the B-band at redshift z. We assumed the luminosity function measured in the VVDS-Deep area by Ilbert et al. (2005; see also Zucca et al. 2006). We take
  when
when  . We note that the number of companions with μ ≥ 1/10 is complete for all principal sources with
  at zr,1 and ~ 50% at zr,2 (Fig. 1), while the completeness is ~ 70%, 80%, 90% and 100% at zr,2 for companions with μ ≥ 1/8,1/7,1/6 and 1/5, respectively. That is,
  only for 1/10 ≤ μ < 1/5 companions of some systems at 0.65 ≤ z < 0.95. We further test the weights
  in Sect. 4.
Since ~ 25% of the total number of potential targets in the VVDS-Deep field have been spectroscopically observed and the redshifts are not measured with 100% certainty, we must correct for the VVDS-Deep target sampling rate and redshift success rate. These have been well constrained resulting in the Target Sampling Rate (TSR) and the Spectroscopic Success Rate (SSR) computed as a function of redshift, source magnitude and source size (x). The SSR has been assumed independent of the galaxy type, as demonstrated up to z ~ 1 in Zucca et al. (2006). As several first epoch VVDS-Deep galaxies with flag 1 and 2 have been re-observed in the VVDS-Ultradeep survey (IAB ≤ 24.75, Le Fèvre et al., in prep.), providing a robust measurement of their redshift, this offers the opportunity to estimate the reliability of VVDS-Deep flag = 1 and 2 sources, and we define a weight w129 to take this into account. We also define the weight w129 for flag = 9 sources by comparison with the latest photometric redshifts in the VVDS-Deep field (see Cucciati et al. 2010, for details about the latest photometric data set in this field). By definition, w129 = 1 for flag = 3 and 4 sources. We derived the spectroscopic completeness weight for each galaxy i in the catalogue as  (4)and assigned a weight
  at each close pair, where
  and
and  are the spectroscopic completeness weights of the principal and the companion galaxy in the pair, respectively.
The last correction we need to apply arises from observations which have been performed under a typical ground based seeing of 1′′. We correct for the increasing incompleteness in targeting both components of close pairs at progressively smaller separations. Assuming a clustered distribution of galaxies, the number of galaxy pairs should be a monotonically decreasing function of the pair separation (e.g., Bell et al. 2006; Lin et al. 2008). However, pairs start to be under-represented for separations θ ≤ 2′′ because of seeing effects. We apply a weight  on each pair using the ratio
  (5)where the mean ratio a is the probability to randomly select a pair, obtained at large separations, and rzz (θk) is the ratio between the observed pair count in the spectroscopic catalogue, Nzz, over the observed pair count in the photometric one, Npp. For large separations (θ > 50′′), rzz ~ a, but at small separations rzz < a because of the artificial decrease of pairs due to seeing effects (see de Ravel et al. 2009, for further details). This weight also accounts for other geometrical biases in the survey, e.g., those related with the minimum separation between slits. Compared to the weight for the total major merger population (de Ravel et al. 2009), the weight for faint companions may be different as it is more difficult to measure the zspec for fainter galaxies located near a bright principal galaxy. To explore this possibility, we compare the number of photometric and spectroscopic pairs for a given angular distance and luminosity difference in the IAB band between the pair members (ΔIAB). We study the variation of rzz (θk,ΔIAB) from θ = 1′′ to 100′′ for four different luminosity ranges, ΔIAB ≤ 0.75, 0.75 < ΔIAB ≤ 1.5, 1.5 < ΔIAB ≤ 2, and 2 < ΔIAB ≤ 2.5. We find that in all cases rzz flattens at large angular separations, while at θ ≲ 10′′ the value of rzz tends to be lower for higher ΔIAB, making it more difficult to recover a faint companion than a bright one. However, when compared with the global value of rzz, this systematic effect leads to differences ≲ 5%. Because the dispersion in the global is ~10%, we have decided not to apply any correction for this systematic effect.
Finally, the corrected merger fraction is  (6)In order to estimate the error of fm we used the jackknife technique (Efron 1982). We computed partial standard deviations, δk, for each system k by taking the difference between the measured fm and the same quantity with the kth pair removed for the sample,
  , such that
  . For a sample with Np systems, the variance is given by
 ![Mathematical equation: \hbox{$\sigma_{f_{\rm m}}^2 = [(N_{\rm p}-1) \sum_k \delta_k^2]/N_{\rm p}$}](/articles/aa/full_html/2011/06/aa15839-10/aa15839-10-eq161.png) . We checked that the variances estimated by jackknife technique are similar, within ~10%, to those estimated by a Bayesian approach (Cameron 2011).
. We checked that the variances estimated by jackknife technique are similar, within ~10%, to those estimated by a Bayesian approach (Cameron 2011).
Merger fraction of  galaxies for
  kpc as a function of luminosity ratio μ.
4. The minor merger fraction of galaxies
In this section we study the merger fraction of bright galaxies as a function of μ, reaching the minor companion regime (1/10 ≤ μ < 1/4) with spectroscopically confirmed close pairs. We summarize the values of fm (≥μ) obtained at zr,1 = [0.2,0.65) and zr,2 = [0.65,0.95) for kpc and different luminosity ratios in Table 1, and show them in Fig. 2. The merger fraction decreases with cosmic time for all μ, but this difference is lower for smaller μ values. The merger fraction at both redshift bins increases when μ decreases, a natural consequence of our fm ( ≥ μ) definition as the fraction of principal galaxies with a LB,2 ≥ μLB,1 companion.
The observed dependence of fm on μ is well parametrized as  (7)where fMM is the major merger fraction (μ ≥ μMM = 1/4). This dependence was predicted by the cosmological simulations of Maller et al. (2006) and used by López-Sanjuan et al. (2010a) in mass-selected spectro-photometric close pairs. We set the value of fMM to the observed one and used Generalized Least Squares (GLS) to estimate the power-law index s (see Appendix A, for details). The GLS fit to the Table 1 data yields s = −0.60 ± 0.08 at z = 0.8 and s = −1.02 ± 0.13 at z = 0.5. To obtain a robust value of s at each redshift range under study, we determine s for different . We summarize our results in Table 2 and show them in Fig. 3. The values of s measured at are representative of the median of all the values at different , that are s = −0.59 at z = 0.8 and s = −0.96 at z = 0.5.
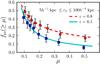 |
Fig. 2 Merger fraction versus luminosity ratio in B-band, μ, for close pairs with |
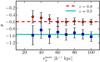 |
Fig. 3 Power-law index s versus |
Power-law index s as a function of search radius .
We find that the value of s decreases with cosmic time, reflecting a differential evolution in the merger fraction of major and minor companions. We checked that our incompleteness in the range zr,2 (Sect. 3) does not bias our results with the following test. We define a companion sample with MB ≤ −17.17−2.8z. This sample becomes artificially incomplete for companions with μ ≥ 1/10 and μ ≥ 1/5 at z ≥ 0.2 and z ≥ 0.65, respectively; that is, in our first redshift bin, and mimic the completeness behaviour of our companion sample at zr,2. Then, we repeat the previous analysis with the artificially incomplete sample, obtaining s = −0.99 ± 0.08, which is similar to the original value measured in the complete sample. This implies that the weights  properly account for the missing faint companions and that the observed evolution of the index s with redshift in VVDS-Deep is a robust result. We also study how the luminosity function assumed in determination affects the measured merger fractions. We used the B-band luminosity functions from Giallongo et al. (2005); Faber et al. (2007); and Zucca et al. (2009), finding a variation lower than 3% in the values of the merger fraction for every compared to our results. Hence, assuming a different luminosity function would have only a limited impact on our results.
We then studied the dependency of the major merger fraction, fMM, on the search radius. We summarize the fMM values for all under study in Table 3 and show them in Fig. 4. The value of fMM increases with the search radius and is well described in both redshift ranges by a power-law with index q = 0.95 ± 0.20. Regarding redshift evolution, the major merger fraction increases with redshift, in agreement with previous results in the literature (e.g., Le Fèvre et al. 2000; Conselice 2006; Rawat et al. 2008; de Ravel et al. 2009; López-Sanjuan et al. 2009a,b). We study this evolution in more detail in Sect. 7.1.
 |
Fig. 4 Major merger fraction, fMM, versus |

We can estimate the minor-to-major merger fraction ratio, denoted fm/M, as  (8)where μMM and μmm are the luminosity ratios for major and minor mergers, respectively. This definition does not depend on the normalization of the merger fraction which varies with (Fig. 4). We assume μMM = 1/4 and μmm = 1/10. We find that fm/M = 0.73 ± 0.13 at z = 0.8, and fm/M = 1.55 ± 0.30 at z = 0.5. Therefore, minor companions become more numerous than major ones at lower redshifts. To illustrate this, and to facilitate future comparisons, we summarize our best estimation of the minor merger fraction for
 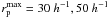 , and 100 h-1 kpc in Table 4, and show the minor, major and total (major + minor) merger fractions for kpc in Fig. 5. The typical error in the minor merger fraction is ~30–40%. Our measurements are consistent with an increase in minor merger fraction with cosmic time. This trend becomes more robust when we further compare our results to a local (z ~ 0.1) estimation of the minor merger fraction, Sect. 7.1.
 |
Fig. 5 Minor (squares), major (dots), and major + minor (triangles) merger fraction of |
Major merger fraction of galaxies, fMM, as a function of search radius .
Minor merger fraction, fm (1/10 ≤ μ < 1/4), of  galaxies.
5. The minor merger fraction of red and blue galaxies
In this section we study the merger fraction as a function of the blue or red colour of the principal galaxy in the pair. To split our galaxies into red and blue, we study their distribution in the MNUV − Mr versus Mr − MJ plane. The UV-optical colours are a better tracer of recent star formation than typical optical – optical colours (Wyder et al. 2007; Schiminovich et al. 2007; Arnouts et al. 2007; Kaviraj et al. 2007), while the addition of an optical-infrared colour to the UV-optical helps to break the degeneracy between old and dusty star-forming (SF) red galaxies (Williams et al. 2009; Ilbert et al. 2010). Another possibility to separate old and dusty red galaxies is to perform a dust reddening correction. This also makes possible a clean separation between the red quiescent sequence and the blue star-forming cloud, since the “green valley” region between both sequences is mainly populated by dusty SF galaxies (Wyder et al. 2007; Cortese et al. 2008; Salim et al. 2009; Brammer et al. 2009).
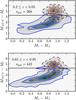 |
Fig. 6 Number density (gray scales) of |
In Fig. 6, we show the number density contours of galaxies in the MNUV − Mr versus Mr − MJ plane for the two redshifts ranges under study, zr,1 = [0.2,0.65) and zr,2 = [0.65,0.95). We only show those galaxies detected in the K band to avoid extrapolating MJ from a fit to the optical photometry. We find a red sequence and a blue cloud in both redshift ranges, as expected from previous works (e.g., Arnouts et al. 2007; Franzetti et al. 2007). Both populations are well separated using a constant cut MNUV − Mr = 4.25. Because of our rest-frame B-band luminosity selection, we do not find a significant population of red (MNUV − Mr ≳ 4), dusty SF (Mr − MJ ≳ 1) galaxies (i.e., they are faint due to the dust extinction). In contrast, this population appears in NIR-selected samples, as those from Ilbert et al. (2010) or Bundy et al. (2010). To explore in more details the nature of red and blue sources, we use the spectro-photometric types (Stypes) of the galaxies. These spectro-photometric types were obtained by fitting 62 templates, that include ellipticals and S0’s (Stype = 1−13), early-type spirals (Stype = 14−29), late-type spirals (Stype = 30−43), and irregulars and starburst (Stype = 44−62; see Zucca et al. 2006, for details). In Fig. 6, we also show the number density contours of galaxies when we split them into early (Stypes ≤ 8) and late (Stypes > 8) types. We show that, as expected, red sequence galaxies are mainly (~90%) early types, while blue cloud is populated (~95%) by later types (see also Arnouts et al. 2007). Because of this, and for simplicity, we define red, quiescent galaxies as those with MNUV − Mr ≥ 4.25, and blue, star-forming galaxies as those with MNUV − Mr < 4.25. We note that the trends and main results in this section remain the same if we either vary the blue-red limit by ± 0.25 mag or use spectro-photometric types to define an early (i.e., red) and a late (i.e., blue) population.
Merger fraction of , red (MNUV − Mr ≥ 4.25) galaxies as a function of luminosity ratio μ for kpc.
With the previous definitions, the principal sample comprises 268 red and 743 blue sources. We look for kpc close companions, regardless of their colour, to ensure good statistics. As was mentioned in the previous section, the trends obtained with this search radius are representative to trends observed at smaller separation. We find that:
-
the merger fraction of red galaxies (
; Table 5) ishigher than the merger fraction of blue galaxies (;Table 6). For major mergers at z = 0.8, both fractions arecomparable; -
evolves little, if any, with cosmic time. Because of this lack of evolution, and to obtain better statistics, we combine both redshift ranges in the following (fourth column in Table 5, and Fig. 7). We find that the power-law index is s = −0.79 ± 0.12 in the range 0.2 ≤ z < 0.95. This implies that red galaxies have a similar number of minor and major companions,
 ;
; -
is lower at z = 0.5 than at z = 0.8. The observed evolution is faster for higher values of μ (Fig. 7), so we obtain different ( > 2σ) values for the power-law index: s = −0.52 ± 0.10 at z = 0.8 and s = −1.26 ± 0.20 at z = 0.5. The ratio of minor-to-major companions of blue galaxies grows from
 at z = 0.8 to
  at z = 0.5.
The fraction of principal galaxies that have a companion and are blue,  , does not depend on μ at z = 0.8, fblue,1 ~ 70%. On the other hand, fblue,1 increases when μ decreases at z = 0.5, varying from fblue,1 ~ 50% at μ ≥ 1/10 to fblue,1 ~ 40% at μ ≥ 1/4, in contrast with ~70% at z = 0.8. The fraction of principal galaxies that have a companion and are red is
 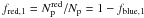 .
.
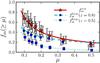 |
Fig. 7 Merger fraction versus luminosity ratio in B-band, μ. Stars, triangles and inverted triangles are the merger fraction of red primaries, |
Merger fraction of , blue (MNUV − Mr < 4.25) galaxies as a function of luminosity ratio μ for kpc.
We find that the fraction of companions that are blue is fblue,2 ~ 0.8, regardless either of the colour of the principal or μ. This means that red-red (dry), red-blue or blue-red (mixed), and blue-blue (wet) pairs account for ~10%/40%/50% of the pairs with a minor companion in all the redshift range under study. This lack of evolution contrasts with the strong evolution of major mergers, for which the relative fractions are ~5%/40%/55% at z = 0.8 (similar to the minor ones), and ~10%/60%/30% at z = 0.5. From z ~ 0.8 to z ~ 0.5, the fraction of wet major mergers decreases by a factor of two, while dry and mixed mergers increase their importance. Our major merger trends are in agreement with de Ravel et al. (2009) using an expanded data set, as well as previous works, e.g., Lin et al. (2008); Bundy et al. (2009). These results show that the relative fraction of dry and mixed major mergers become more important with cosmic time for  galaxies in our redshift range due to the lack of blue primaries with major companions at low redshift, rather than from an increase in the major merger fractions of red galaxies as also pointed out by Lin et al. (2008).
Previous work finds that the major merger fraction from close pairs depends on mass, with more massive galaxies having higher merger fractions (de Ravel et al. 2009; Bundy et al. 2009). If blue principal galaxies at z = 0.8 were more massive by a factor of 3 than at z = 0.5 because of our B-band luminosity selection, this would explain the observed trend in . Using stellar masses determined in Pozzetti et al. (2007), we do not find a significant change (less than 0.1 dex) in the median mass of red,  , and blue,
  , principal galaxies. This supports that the observed trends reflect a real evolution in the merger properties of blue galaxies. In addition, our results imply that more massive (red) galaxies have higher merger fractions than lower mass (blue) galaxies, in agreement with de Ravel et al. (2009) and Bundy et al. (2009). The study of the major and minor merger fraction in mass selected galaxies is beyond the scope of the present paper, and we will address this issue in a future work.
6. The minor merger rate of galaxies
6.1. The minor merger rate of the full population
Our goal in this section is to estimate the minor merger (1/10 ≤ μ < 1/4) rate of bright galaxies in the range 0.2 ≤ z < 0.95. In the following we name the merger rate the number of mergers per Gyr per galaxy, noted R. Because the parameters involved in the translation of the merger fraction to the merger rate are better constrained for major mergers, we estimate them first and then expand to the minor merger rate.
Following de Ravel et al. (2009), we define the major merger rate as 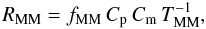 (9)where the factor Cp takes into account the lost companions in the inner 5 h-1 kpc (Bell et al. 2006) and the factor Cm is the fraction of the observed close pairs that finally merge in a typical timescale TMM. We take
  . The typical merger timescale depends on and can be estimated by cosmological and N-body simulations. We compute the major merger timescales from the cosmological simulations of Kitzbichler & White (2008), based on the Millennium simulation (Springel et al. 2005). These major merger timescales, denoted
  , refer to major mergers (μ > 1/4 in stellar mass), and depend mainly on and on the stellar mass of the principal galaxy, with a weak dependence on redshift in our range of interest (see de Ravel et al. 2009, for details). Taking log (M ⋆ /M⊙) = 10.7 as the average stellar mass of our principal galaxies with a close companion, we obtain the values in Table 7 for
  , 50 and 100 h-1 kpc, and Δvmax = 500 km s-1. In every case we assume an uncertainty of 0.2 dex in the mass of the principal galaxies to estimate the error in
  . These timescales already include the factor Cm (see Patton & Atfield 2008; Bundy et al. 2009; Lin et al. 2010), so we take Cm = 1 in the following. These timescales are for central-satellite mergers, and satellite-satellite pairs could have different timescales. However, only 1 of the 103 close pairs under study is satellite-satellite, so the use of principal-satellite timescales is justified. We also remark that the velocity condition Δvmax = 500 km s-1 selects close bound systems even when they are located in dense environments, but in these environments the probability of finding unbound close pairs increases. This is taken into account in the cosmological averaged merger timescales (see also Lin et al. 2010).
Since the assumed merger timescale is the most uncertain quantity in Eq. (9), we compare with other recent estimations in the literature. Lotz et al. (2010b) perform N-body/hydrodynamical simulations of major and minor mergers to study the merger timescales of morphological and close pair approaches. The principal galaxy in their simulations has log (M ⋆ /M⊙) = 10.7, similar to the average mass of our principal galaxies with a close companion, so their major merger timescales, denoted  , should be comparable to the previous . We summarize the average values of in Table 7 after correcting with the factor Cp. We find that
  . However, the include the factor Cm, while the do not. Applying to a typical value of Cm = 0.6 (Patton et al. 2000; Lin et al. 2004, 2010; Bell et al. 2006), we find that both timescales agree and therefore yield similar merger rates. On the other hand, Lin et al. (2010) use cosmological simulations to study Cm and the merger timescale, denoted
  . They find
  Gyr for log (M ⋆ /M⊙) ~ 10.3 galaxies and rp ≤ 50 h-1 kpc (this value includes the factor Cm = 0.7 derived from their simulations). This timescale is lower by a factor of two than the one from Kitzbichler & White (2008) for this mass,
  Gyr. However, Kitzbichler & White (2008) assume that the galaxy merger occurs a dynamical friction time after the dark matter halo merger; while Lin et al. (2010) do not consider this additional time. This fact lessens the difference between both works, but a more detailed comparison is needed. In the following we omit the superscript index in for clarity.
The merger rate is an absolute quantity, and should not depend on the that we use to infer it. Because of this, the increase of the merger fraction with (Sect. 4, Fig. 4) must be compensated with the increase in TMM. For two different search radius,  and
and  , this implies that
 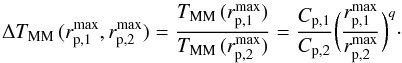 (10)From our observational results we infer that ΔTMM(50,30) = 1.5 and ΔTMM(100,50) = 1.8. These values compare well with the ratios from Table 7 timescales, ΔTMM(50,30) = 1.6 and ΔTMM(100,50) = 1.8. This supports the robustness of our assumed TMM, although the normalization of these timescales have a factor of two uncertainty. We estimate the final major merger rate by averaging the values derived from the 30, 50 and 100 h-1 kpc merger fractions, and its error as the average of the individual merger rates’ errors.
Major merger timescales of galaxies.
Minor, major and total merger rate of  galaxies.
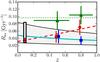 |
Fig. 8 Merger rate of |
We obtain the minor merger rate, defined as the merger rate of 1/10 ≤ μ < 1/4 close pairs, from the major one as  (11)where the factor Υ accounts for the difference in the minor merger timescale with respect to the major merger one in close pairs, Tmm = Υ × TMM. Only a few studies in the literature attempt to estimate Υ: Jiang et al. (2008) study the merger timescale of dark matter haloes, finding Υ ~ 2. On the other hand, Lotz et al. (2010b) obtain Υ = 1.5 ± 0.1 from N-body/hydrodynamical simulations. As we have already shown, the major merger timescales from Lotz et al. (2010b) are similar to ours, so we assume the minor-to-major merger time scale from Lotz et al. (2010b) in the following. We also assume that the factor Cm for minor mergers is the same as the one for major mergers.
Finally, the total merger rate is Rm = RMM + Rmm. We summarize our results on the merger rates in Table 8, and we show them in the Fig. 8. We find that
-
1.
the minor merger rate Rmm (1/10 ≤ μ < 1/4) decreases with increasing redshift, although our measurements are consistent with a constant minor merger rate within errors. We further discuss the evolution of Rmm in Sect. 7.3. This is the first quantitative measurement of the minor merger rate using close pair statistics at these redshifts;
-
2.
this trend is significantly different from the evolution of the major merger rate (μ ≥ 1/4) which we determine as increasing with redshift, in agreement with de Ravel et al. (2009), and previous studies in the literature (e.g., Le Fèvre et al. 2000; Conselice et al. 2003, 2009; López-Sanjuan et al. 2009b; Bridge et al. 2010);
-
3.
the total merger rate (major + minor) is consistent either with a mild increase with redshift or with a constant Rm ~ 0.1 Gyr-1.
6.2. The minor merger rate of red and blue galaxies
We apply the steps in the previous section to estimate the major, minor and total merger rate of red and blue galaxies. We take  Gyr and
  Gyr for kpc because of different average stellar mass of red and blue principal galaxies, whilst the factor Υ does not depend on the gas content of the galaxies (Lotz et al. 2010a). The merger rates that we obtain are listed in Table 8. The merger rates (minor and major) of red galaxies do not evolve with redshift in the range under study,
  Gyr-1 and
  Gyr-1. González-García et al. (2009) find that the minor and major merger rate of Elliptical Like Objects (ELOs) at z ~ 0.75 in their cosmological simulations are Rmm = 0.06 Gyr-1 and RMM = 0.08 Gyr-1, in good agreement with our observed values. On the other hand, Stewart et al. (2009) model predicts that Rmm ~ RMM for μMM = 1/3 (see also Hopkins et al. 2009c), while from our observations we infer Rmm = 1.1 × RMM for μMM = 1/3.
The minor merger rate of blue galaxies, denoted  , increases by ~20% from z = 0.8 to z = 0.5, but the measured values are compatible with a constant merger rate within error bars,
  Gyr-1. On the contrary, the major merger rate, denoted
  , decreases by a factor of three from z = 0.8 to z = 0.5, as noted by de Ravel et al. (2009). These trends suggest that the stability or increase with cosmic time of the minor merger rate found in the previous section is a consequence of the evolution in the fraction of bright galaxies that are red: as time goes by, the red fraction increases (e.g., Fontana et al. 2009; Ilbert et al. 2010). Because the minor merger rate of red galaxies is a factor of ~2.5 higher than the one of blue galaxies, and both are roughly constant, the increase in the red fraction implies an increase in the global (red+blue) minor merger rate. This effect is also present in the major merger rate, but in this case decreases with cosmic time, and the increase in the red fraction is milder, as found by de Ravel et al. (2009).
6.3. The volumetric minor merger rate
The volumetric merger rate (i.e., the number of mergers per unit volume and time) is a complementary measure to the merger rate estimated in the previous sections. To obtain the volumetric merger rate, denoted ℜ, we multiply the merger rate by the number density of all/red/blue galaxies with in VVDS-Deep at each redshift (Ilbert et al. 2005). We summarize the values of ℜ in Table 9. All trends are similar to those found in the previous section. Interestingly, we find that  . The merger rate of red galaxies is a factor of ~2.5 higher than the blue ones, but the number density of the latter is higher than of the former, hence making the volumetric merger rates comparable.
Minor, major and total volumetric merger rate of galaxies.
7. Discussion
In this section we estimate the evolution of the minor merger fraction and rate with redshift, and discuss the contribution of minor mergers to the evolution of bright galaxies since z ~ 1, comparing it to the contribution of major mergers.
7.1. The evolution of the minor merger fraction with redshift
The evolution of the merger faction with redshift up to z ~ 1.5 is well parametrized by a power-law (e.g., Le Fèvre et al. 2000; López-Sanjuan et al. 2009b; de Ravel et al. 2009), 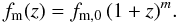 (12)Our results alone suggest that the merger fraction evolves faster for higher μ, with m = 5.6 for equal luminosity companions (μ = 1), m = 2.4 for major companions with μ ≥ 1/4, and m = 0.8 for major + minor companions (μ ≥ 1/10). This mild evolution in the total (major + minor) merger fraction is also suggested by the morphological studies of Lotz et al. (2008) and Jogee et al. (2009).
To better constrain the evolution with redshift of the minor merger fraction, a local reference is important. Darg et al. (2010) estimate that the minor merger fraction is similar to the major one (fm/M ~ 1, μ ≳ 1/3) in Galaxy Zoo3 (Lintott et al. 2008); the latter is based on the visual classification of Sloan Digital Sky Survey (SDSS4, Adelman-McCarthy et al. 2006) galaxies by internet users. However, their sample is incomplete for minor companions, so their fm/M is a lower limit. On the other hand, Woods & Geller (2007) study the different properties of major (Δmz < 2, μ ≳ 1/7) and minor (Δmz > 2, μ ≲ 1/7) close pairs in SDSS. Unfortunately, they do not attempt to derive merger fractions, but the influence of close companions on galaxy properties (see also Ellison et al. 2008; Patton et al. 2011). Therefore, to our knowledge, there does not seem to be any local estimation of the minor merger fraction of bright galaxies in the literature. As a close proxy, we estimate the local merger fraction as fmm = fm (μ ≥ 1/10) − fMM. We follow the methodology in Sect. 3 to measure the major (μ ≥ 1/4) merger fraction of  galaxies at z = 0.09 from the Millennium Galaxy Catalogue (MGC5, Liske et al. 2003). This survey comprises 10 095 galaxies with BMGC < 20 over 37.5 deg2, with a spectroscopic completeness of 96% (Driver et al. 2005; see also De Propris et al. 2005, 2007). We obtain
  for kpc. We then assume two different types of evolution for the major + minor merger fraction: (1) a constant evolution with redshift, fm (μ ≥ 1/10) = 0.461 for kpc, which implies fmm(0.09) = 0.322; and (2) an evolution which evolves with redshift as m = 0.8 (fit of a power-law function to our observational major + minor merger fractions), which implies fmm(0.09) = 0.187. Finally, we fit Eq. (12) to our minor merger fraction data and both local estimates, defining a confidence area for the minor merger fraction between z = 0 and z = 1 (Fig. 5). This area is limited by the following curves,
 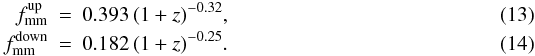 The power law-index from the fits is m = −0.4 ± 0.7. The negative value implies that the minor merger fraction decreases with increasing redshift. We note that our results are compatible with a constant fmm since z = 1 (i.e., m = 0). Even in this case, the minor merger fraction does not evolve in the same way as the major one which increases with redshift (m > 0, see below). Abbas et al. (2010) use Halo Occupation Distribution (HOD) models to interpret the evolution since z ~ 1 of the correlation function from VVDS-Deep (see also Le Fèvre et al. 2005a) and SDSS. Their results suggest that the average number of satellite galaxies per dark matter halo increases with cosmic time, which could be related with our suggested increase in the minor merger fraction. Specifically, we expect the minor merger fraction in the local universe to be two to three times the major merger one. Direct measurements of the minor merger fraction at low redshift will be needed to better constrain the minor merger fraction evolution with z.
The least-squares fit to the major merger data yields (Fig. 5)  (15)In a previous work in VVDS-Deep, de Ravel et al. (2009) measured the major merger fraction (μ ≥ 1/4) of less luminous galaxies than those reported in present paper. They find that the major merger fraction evolves faster with z for fainter samples, with a power-law index m = 4.7 for
  galaxies and m = 3.1 for
  galaxies. The evolution of m = 1.3 for the major merger fraction of
  galaxies confirms the trend found by de Ravel et al. (2009) and extends it to brighter galaxies.
7.2. The evolution of the power-law index s with redshift
In a previous study, López-Sanjuan et al. (2010a) have attempted to measure the power-law index s. They find s ~ −0.6 at z ∈ [0.2,1.1) for principal galaxies with M ⋆ ≳ 1010 M⊙. This value is similar to ours at z = 0.8, but at z ~ 0.5 the discrepancy between both studies is important (>2σ). This suggests that s depends not only on both redshift and colour, but also on stellar mass. Because the B-band luminosities of red galaxies are only slightly affected by star formation, our red merger fraction is a proxy of the merger fraction of log (M ⋆ /M⊙) ~ 10.8 galaxies. We therefore find that the power-law index does not evolve for massive galaxies, s = −0.79 ± 0.12. This, combining with López-Sanjuan et al. (2010a) results, suggests that (i) s does not evolve with z in mass-selected samples; that is, the evolution of the total (major + minor) merger fraction is similar to that of the major merger one, as predicted by the cosmological models of Stewart et al. (2009), and (ii) the power-law index is lower for massive galaxies indicating that massive galaxies have a higher minor-to-major merger ratio than less massive ones. The different minor merger fractions in mass-selected samples will be the subject of a future paper.
7.3. The redshift evolution of the minor merger rate
Similarly to the minor merger fraction there does not seem to exist any published reference in the refereed literature for the local minor merger rate. We follow the same steps as in Sect. 7.1 to estimate a confidence area for the minor merger rate in the range 0 < z < 1. The major merger rate in the MCG at z = 0.09 is 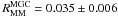 Gyr-1, while the confidence region is limited by the following curves (Fig. 8),
 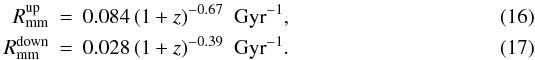 The power law-index inferred from the fits is n = −0.5 ± 0.7. As in Sect. 7.1, a negative power-law index for Rmm implies that the minor merger rate decreases with redshift. Also in this case the value of n is compatible with a constant minor merger rate (n = 0), but again its evolution is different than that of the major merger rate, that increases with redshift (n > 0, see below). A local reference is needed to better constraint the evolution of Rmm. If we repeat this study with the volumetric merger rate, the confidence area is limited by
 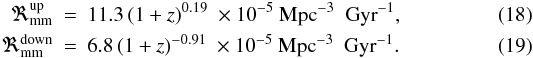 In this case the evolution is n = −0.5 ± 0.7.
The fit to both major merger rates is 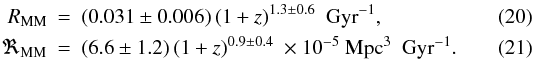 de Ravel et al. (2009) estimate the volumetric major merger rate (μ ≥ 1/4) finding, as for the merger fraction, that it evolves faster for fainter samples, with a power-law index n = 2.2 for galaxies and n = 1.6 for galaxies, so our n = 0.9 follows the trend of decreasing n for brighter galaxies found by de Ravel et al. (2009). On the other hand, the volumetric merger rate of galaxies is a factor of ~5 higher than the one of galaxies. This is because the number density is lower for bright galaxies than for the fainter ones. The same trend is observed in mass-selected samples (López-Sanjuan et al. 2009a).
7.4. The role of minor mergers in the mass assembly of luminous galaxies
We can obtain the average number of mergers per galaxy between z2 and z1 < z2 as 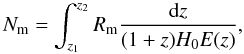 (22)where
 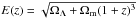 in a flat universe. The definitions of NMM and Nmm are analogous. Using results from the previous section, we obtain Nm = 0.73 ± 0.21, with NMM = 0.37 ± 0.13 and Nmm = 0.36 ± 0.17 from z = 1 to z = 0, indicating that the number of minor mergers per bright galaxy since z = 1 is similar to the number of major ones. Note that these values and those reported in the following have an additional factor of two uncertainty due to the merger timescales derived from simulations (Sect. 6.1). In their work, Pozzetti et al. (2010) find that almost all the evolution in the stellar mass function since z ~ 1 is a consequence of the observed star formation (see also Vergani et al. 2008), and estimate Nm ~ 0.7 mergers since z ~ 1 per log (M ⋆ /M⊙) ~ 10.6 galaxy, similar to the average mass of our galaxies, are needed to explain the remaining evolution. Their result agrees with our direct estimation, but they infer NMM < 0.2. This value is half of ours, pointing out that close pair studies are needed to understand accurately the role of major/minor mergers in galaxy evolution.
In addition to the mean number of mergers per galaxy, we have estimated the mass accreted by bright galaxies since z = 1 due to major and minor mergers. For this, we take μ as a proxy of the mass ratio between the galaxies in the pair. We can determine the mean merger ratio of major ( ), and minor mergers (
 ) as
) as 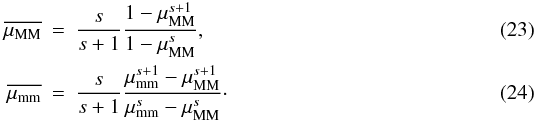 For μMM = 1/4 and μmm = 1/10 we obtain
  and
and  , values that depend slightly on s: the mean merger ratios change less than 10% in the range probed by our results, s ∈ [−1.25, −0.58] . We assume these values of and hereafter. Weighting the number of mergers with its corresponding merger ratio, we infer that mergers of companions with μ in the range 1/10 to 1 increase the mass of bright galaxies since z = 1 by 23 ± 8%. We further infer that the relative contribution of major and minor mergers to this mass assembly is 75% and 25%, respectively. Because the factor of two uncertainty in the merger timescales affects in the same way major and minor mergers, this relative contribution is a robust result. In their cosmological models, Hopkins et al. (2010a) predict that the relative contribution of major and minor mergers in the spheroids assembly of log (M ⋆ /M⊙) ~ 10.6 galaxies is ~80%/20%, in good agreement with our observational result.
Therefore, we have demonstrated that minor mergers do contribute to the mass assembly of bright galaxies, at a level corresponding to about a third of the major mergers contribution.
7.5. Mergers and the evolution of red galaxies since z ~ 1
Because the merger properties of red and blue galaxies are very different, we estimate here the role of minor and major mergers in the evolution of red galaxies since z ~ 1. We assume a constant major and minor merger rate for red galaxies from z = 0 to z = 1, as found in Sect. 6. Applying Eq. (22) to  and
and  , we obtain that the average number of mergers per red galaxy since z = 1 is
  , with
  and
and  . These values are higher than those from the global population, reflecting the higher merger rate of red galaxies.
We find that red galaxies of log (M ⋆ /M⊙) ~ 10.8 have undergone ~ 1.2 merger events since z ~ 1, but it is important to quantify the impact of mergers in the mass assembly of these galaxies. Weighting the number of mergers with their corresponding mean merger ratio (Eqs. (23) and (24)), we find that mergers can increase 40 ± 10% the mass of red galaxies since z = 1. Because blue companions have a lower mass-to-light ratio than the red ones, this mass increase is an upper limit. The relative contribution of major/minor mergers to this mass assembly is 80%/20%, indicating that the mass of red galaxies increases by ~ 10% since z = 1 due to minor mergers.
Several authors have studied luminosity functions (LF) and clustering to constrain the evolution of luminous red galaxies (LRGs) with redshift. They find that the bright end (L ≳ 2.5L ∗ ) of the LF is mostly in place since z ~ 0.8 (e.g., Zucca et al. 2006; Brown et al. 2007; Scarlata et al. 2007). Since LRGs have a negligible star formation (Roseboom et al. 2006), the evolution of the bright end of the LF, if any, must be due to mergers. Brown et al. (2008) find that bright LRGs (MB ≲ −21.8 ~ 4L ∗ ) have increased their mass ~30% since z = 1 (see also Brown et al. 2007), in agreement with our result. Cool et al. (2008) state that L > 3L ∗ galaxies have increased their stellar mass less than 50% since z ~ 0.9, an upper limit also consistent with our measurement. On the other hand, van Dokkum et al. (2010) study the evolution of massive galaxies with log (M ⋆ /M⊙) ≳ 11.3 since z ~ 2, inferring that they increase their mass ~40% since z ~ 1 to the present by mergers (i.e., their star-formation is negligible in that redshift range, see also Walcher et al. 2008; and Drory & Alvarez 2008), in good agreement with our direct measurement. Although the stellar mass and luminosity range probed by van Dokkum et al. (2010) and previous LF works is ~3 times higher than ours, and we use B-band luminosity as a proxy of mass, the agreement with these studies is remarkable and supports that mergers are an important contributor to the evolution of the most massive red galaxies since z ~ 1.
While mergers directly increase the mass in red galaxies, they also modify their inner structure. It is now well established that massive, log (M ⋆ /M⊙) ≳ 11, early-type galaxies have, on average, lower effective radius (re) at high redshift than locally, being ~2 to ~4 times smaller at z ~ 1 and z ~ 2, respectively (Daddi et al. 2005; Trujillo et al. 2006, 2007; Buitrago et al. 2008; van Dokkum et al. 2008, 2010; van der Wel et al. 2008; Toft et al. 2009; Williams et al. 2010). These high-redshift compact galaxies are sparse in the local universe (Trujillo et al. 2009; Taylor et al. 2010), implying that they evolve since z ~ 2 to the present. It has been suggested that compact galaxies are the cores of present day ellipticals, and that they increase their size by adding stellar mass in the outskirts of the galaxy (Bezanson et al. 2009; Hopkins et al. 2009a; van Dokkum et al. 2010). Equal-mass mergers (μ = 1) are efficiently increasing the mass of the galaxies, but not their size (re ∝ M ⋆ ); while for un-equal mass mergers (μ < 1) the size increase is higher for the same accreted mass ( ; Bezanson et al. 2009; Hopkins et al. 2010b). We find that red galaxies increase their mass ~40% since z ~ 1 due primarily to un-equal mass mergers. This corresponds to a size increase by a factor of ~2, which is similar to the growth derived by size studies. Our results therefore suggest that un-equal mass mergers (μ < 1) could be the dominant process in the size growth of massive galaxies since z ~ 1, as predicted by the cosmological simulations of Naab et al. (2009) or Hopkins et al. (2010b). Future studies of the merger fraction as a function of the size of galaxies are needed to better understand the evolution of compact galaxies.
Kaviraj et al. (2011) found that ~30% of early types at 0.5 < z < 0.7 present distorted morphologies. This fraction is ~25% if we restrict the analysis to MV ≲ − 21.5 galaxies (this selects  galaxies at z = 0.6 assuming B − V = 0.7, the main MB − MV colour of our red galaxies in the range 0.5 < z < 0.7). Interestingly, Conselice et al. (2007) also found that ~ 25% of the early-types with log (M ⋆ /M⊙) ≥ 10.8 in the Palomar/DEEP2 survey present signs of interactions at these redshifts. If we assume a visibility timescale of TdET ~ 1 Gyr for Kaviraj et al. (2011) distorted early-types (dET), we need a total (major + minor) merger rate of RdET ~ 0.25 Gyr-1 to explain the observed fraction of dET. This value is higher than our red merger rate,
  Gyr-1, but we infer and additional
  from the major merger rate of blue galaxies, that can also lead to dET (Sect. 7.6). Mergers could therefore be common enough to explain the observed frequency of dET at z = 0.6, with minor mergers accounting for ~30% of the observed dET. N-body simulations are needed to better determine TdET and the minimum μ that produces observable tidal features. We also note that minor mergers with luminosity or mass ratios less than 1/10 may also contribute significantly, and will need to be investigated.
Kaviraj et al. (2011) also show that the majority of dET have blue NUV − r rest-frame colours, a signature of episodes of recent star formation (RSF). The fraction of the stellar mass formed in the RSF is f ⋆ , RSF ~ 3–20% (see also Scarlata et al. 2007; Kaviraj et al. 2008), while the derived metallicity makes unlikely gas-rich mergers as the origin of this RSF. We find that ~80% of the companions of the red primaries are blue indicating that there is a gas supply to the RSF, while the stellar mass is dominated by the red, old component of both galaxies. Using the recipe provided by Stewart et al. (2009) to determine Mgas/M ⋆ , where Mgas is the mass of gas in the galaxy, we explore the mass and μ range of our red pairs, and estimate that the gaseous mass is typically ≲ 25% of the total stellar mass in our red pairs. Simulations suggest that ~50–75% of the gas in mergers can be consumed to form new stars (Cox et al. 2004, 2006). This leads to a f ⋆ , RSF ≲ 20%, in agreement with the observed mass formed in the RSF episodes. This result supports mergers as the main cause of RSF in early-type galaxies since z ~ 1 (see also Fernández-Ontiveros et al. 2011).
Bundy et al. (2010) find that the red sequence is populated not only by E/S0 galaxies, but also by passive, early-type (i.e., bulge dominated) spirals. While 80% of the mergers experienced by a red galaxy are with a blue SF companion, the low gaseous mass involved in these mergers ( ≲ 25%) prevent the regrowth of a spiral disc (Hopkins et al. 2009b). Hence, our observed merger rate could be sufficient to transform the red, early-type spirals into E/S0 galaxies. A more detailed study of the merger fraction of red galaxies as a function of their morphology is needed to understand the transition between red spirals and E/S0 galaxies.
Summarizing, our measured merger rates of bright red galaxies are in agreement with the mass and size evolution of massive red galaxies since z = 1, and with the frequency of distorted early-type galaxies at z ~ 0.6. Minor mergers have a significant impact in the evolution of these massive red galaxies, accounting of ~ 20% of the observed evolution.
7.6. The role of minor mergers in the evolution of blue galaxies
Observations and N-body simulations suggest that major mergers between gas-rich late-type galaxies are an efficient way to obtain quiescent, early-type galaxies (Naab et al. 2006; Rothberg & Joseph 2006a,b; Rothberg & Fischer 2010; Hopkins et al. 2008, 2009b). Recent studies find that gas-rich major mergers can only account for 20–30% of the number density evolution in the red sequence of intermediate-mass (M ⋆ ≳ 1010 M⊙) galaxies since z = 1 (Bundy et al. 2009; Wild et al. 2009; de Ravel et al. 2009; López-Sanjuan et al. 2010b,a), while major mergers are enough to explain the number evolution of massive galaxies in the same redshift range (M ⋆ ≳ 1011 M⊙, Eliche-Moral et al. 2010a,b; Robaina et al. 2010; Oesch et al. 2010).
Hence, we need mechanisms other than major mergers to transform intermediate-mass blue cloud galaxies into red sequence ones. One possible mechanism is minor merging. The N-body simulations find that minor mergers increase the Sérsic index of galaxies (Eliche-Moral et al. 2006) and that several minor mergers have the same effect as a major one: only the final mass accreted is important (i.e., ten 1/10 mergers are equivalent to one equal-mass merger, Bournaud et al. 2007). We find that the minor-to-major merger ratio of blue galaxies increases between z = 0.8 and z = 0.5 from ~0.5 to ~2, indicating that minor mergers may play an important role in the growth of the red sequence since z ~ 0.5. However, we find that the mass accreted by minor mergers is ~15% of the mass accreted by major mergers at z = 0.8, and ~0.6 at z = 0.5. Even in the lower redshift range, where minor mergers are twice more common than major ones in blue galaxies, the latter are more efficient in transforming gas-rich galaxies into E/S0. In addition, the observed implies that, in the range [0.2,0.95), a gas-rich galaxy have only undergone  minor mergers, making it unlikely that a gas-rich galaxy suffers more than one minor merger since z ~ 1. In summary, our observations indicate that minor mergers have a less important effect on the structure of gas-rich galaxies than major mergers do in the redshift range we investigate, and they can create early spirals as opposed to E/S0 galaxies.
It is also expected that secular processes can transform late spirals into early ones. Bars and disk instabilities support the growth of the central part of the galaxies, called pseudo-bulges (Kormendy & Kennicutt 2004; Fisher et al. 2009). The similar disc and nuclear colours of spirals up to z ~ 0.8 (Domínguez-Palmero & Balcells 2008) also points towards a coordinated growth of the bulge and the disc, while Masters et al. (2011), and Sheth et al. (2008) and Cameron et al. (2010) find that early-type spirals have higher bar fractions than late-type ones in Galaxy Zoo (z ~ 0.04), and COSMOS6 (0.2 < z < 0.85), respectively. The comparison of the observational (this paper, López-Sanjuan et al. 2010a) and theoretical (Oesch et al. 2010) major + minor merger rate against the number density growth of intermediate-mass, early-type galaxies also suggests that secular processes are needed.
If these early, bulge-dominated systems, whatever their origin, have their star formation shut down by some processes unrelated to mergers, as gas exhaustion (Zheng et al. 2007; Bauermeister et al. 2010) or some form of quenching (e.g., morphological quenching, Martig et al. 2009; or environment quenching, Peng et al. 2010), they then become passive early-type discs on the red sequence, as those found by Bundy et al. (2010).
It is also worth noting that because the merger fraction increases when μ decreases, it is possible that galaxies smaller or fainter than studied in this paper may play a significant role. However, we find that the increase in the merger fraction cannot compensate for the decrease in the mass of the companion and the increase in the typical merger timescale, so it is not expected that mergers with μ < 1/10 have been important in the evolution of intermediate-mass gas-rich galaxies. Cosmological models also suggest that merger events lower than μ < 1/10 have little impact (less than 10%) in the mass assembly of spheroids (Hopkins et al. 2010a).
8. Summary and conclusions
We have estimated, for the first time, the minor merger fraction and rate of galaxies from kinematically confirmed close pairs, reaching the minor companion regime, 1/10 ≤ μ < 1/4 (ΔMB = 1.5 − 2.5) thanks to the deep spectroscopy in VVDS-Deep (IAB ≤ 24), and robust statistics in a wide 0.5 deg2 area.
We find that minor mergers for bright galaxies show little evolution with redshift and follow a power-law (1 + z)m with index m = −0.4 ± 0.7 for the merger fraction and m = −0.5 ± 0.7 for the merger rate, while the major merger fraction (m = 1.3 ± 0.5) and rate (m = 1.3 ± 0.6) for the same galaxies increases. The dependence of the merger fraction on μ is well described by a power-law function, fm ( ≥ μ) ∝ μs. The value of s for the complete magnitude-limited sample, , evolves from s = −0.60 ± 0.08 at z = 0.8 to s = −1.02 ± 0.13 at z = 0.5. When we split our bright galaxies in red and blue following the bimodal rest-frame colour, we find that, in the redshift range explored, i) fm is higher for red galaxies at every μ, ii) does not evolve with z, with s = −0.79 ± 0.12 at 0.2 < z < 0.95, and iii) evolves dramatically: the major merger fraction of blue galaxies decreases by a factor of three with cosmic time, while the minor merger fraction of blue galaxies is roughly constant.
Our results show that normal galaxies have undergone 0.4 minor and 0.4 major mergers since z ~ 1, which implies a total mass growth from major and minor mergers with μ ≥ 1/10 by about 25%. The relative contribution of the mass growth by merging is ~25% due to minor mergers with 1/10 ≤ μ < 1/4 and ~75% due to major mergers with μ ≥ 1/4. The relative effect of merging is more important for red than for blue galaxies, with red galaxies subject to 0.5 minor and 0.7 major mergers since z ~ 1. This leads to a mass growth of ~40% and a size increase by a factor of 2 for red galaxies, in agreement with the evolution of massive galaxies as reported by previous works (e.g., van der Wel 2008; van Dokkum et al. 2010). This supports the idea that mergers are an important contributor to the evolution of the most massive red galaxies since z ~ 1. For blue galaxies, our results imply that minor mergers likely lead to early-type spirals rather than elliptical galaxies.
Our analysis therefore shows that minor merging is a significant but not dominant mechanism contributing to the mass growth of galaxies in the last ~8 Gyr. Merging alone is not sufficient to explain the observed mass growth of galaxies, and other processes must therefore be operating. The contribution from minor merging of low mass companions with μ < 1/10 has yet to be estimated, but we expect that this contribution will have only limited importance.
To extend these on our observational results, the study of the minor merger fraction in other fields will be needed to minimize cosmic variance effects, and larger samples will be needed to better constrain the evolution of fmm with redshift. In addition, the study of the dependence of minor mergers on properties like mass, morphology or environment will provide other important clues about the role of mergers in the evolution of galaxies since z ~ 1. It is also worth noting that direct measurements of the minor merger fraction have yet to be made at low redshift and this will be needed in order to better constrain the minor merger fraction evolution with z.
We did not use galaxies with flag = 1 and 21 to determine the groups. However, only 2% of the principal galaxies have flag = 1 or 21 because they are bright.
Cosmological Evolution Survey, Scoville et al. (2007) (http://cosmos.astro.caltech.edu/index.html).
Acknowledgments
We dedicate this paper to the memory of our six IAC colleagues and friends who met with a fatal accident in Piedra de los Cochinos, Tenerife, in February 2007, with special thanks to Maurizio Panniello, whose teachings of python were so important for this paper. We thank the anonymous referee comments and suggestions which improved the quality of the paper.
C.L.S. acknowledge the funding support of ANR-07-BLAN-0228 and the help of A. Ealet in the statistical analysis. A.P. has beed supported by the research grant of the Polish Ministry of Science Nr N N203 51 29 38 and the European Associated Laboratory “Astrophysics Poland-France”. This work uses the Millennium Galaxy Catalogue, which consists of imaging data from the Isaac Newton Telescope and spectroscopic data from the Anglo Australian Telescope, the ANU 2.3 m, the ESO New Technology Telescope, the Telescopio Nazionale Galileo, and the Gemini North Telescope. This survey was supported through grants from the Particle Physics and Astronomy Research Council (UK) and the Australian Research Council (AUS). The data and data products of this survey are publicly available from http://www.eso.org/~jliske/mgc/ or on request from J. Liske or S. P. Driver.
References
- Abbas, U., de La Torre, S., Le Fèvre, O., et al. 2010, MNRAS, 406, 1306 [NASA ADS] [Google Scholar]
- Adelman-McCarthy, J. K., Agüeros, M. A., Allam, S. S., et al. 2006, ApJS, 162, 38 [NASA ADS] [CrossRef] [Google Scholar]
- Aitken, A. C. 1935, Proc. R. Soc. Edinb., 55, 42 [Google Scholar]
- Arnouts, S., Walcher, C. J., Le Fèvre, O., et al. 2007, A&A, 476, 137 [NASA ADS] [CrossRef] [EDP Sciences] [Google Scholar]
- Bauermeister, A., Blitz, L., & Ma, C. 2010, ApJ, 717, 323 [NASA ADS] [CrossRef] [Google Scholar]
- Bell, E. F., Phleps, S., Somerville, R. S., et al. 2006, ApJ, 652, 270 [NASA ADS] [CrossRef] [Google Scholar]
- Bezanson, R., van Dokkum, P. G., Tal, T., et al. 2009, ApJ, 697, 1290 [NASA ADS] [CrossRef] [Google Scholar]
- Bournaud, F., Jog, C. J., & Combes, F. 2007, A&A, 476, 1179 [NASA ADS] [CrossRef] [EDP Sciences] [Google Scholar]
- Brammer, G. B., Whitaker, K. E., van Dokkum, P. G., et al. 2009, ApJ, 706, L173 [NASA ADS] [CrossRef] [Google Scholar]
- Bridge, C. R., Carlberg, R. G., & Sullivan, M. 2010, ApJ, 709, 1067 [NASA ADS] [CrossRef] [Google Scholar]
- Brown, M. J. I., Dey, A., Jannuzi, B. T., et al. 2007, ApJ, 654, 858 [NASA ADS] [CrossRef] [Google Scholar]
- Brown, M. J. I., Zheng, Z., White, M., et al. 2008, ApJ, 682, 937 [NASA ADS] [CrossRef] [Google Scholar]
- Buitrago, F., Trujillo, I., Conselice, C. J., et al. 2008, ApJ, 687, L61 [NASA ADS] [CrossRef] [Google Scholar]
- Bundy, K., Ellis, R. S., & Conselice, C. J. 2005, ApJ, 625, 621 [NASA ADS] [CrossRef] [Google Scholar]
- Bundy, K., Fukugita, M., Ellis, R. S., et al. 2009, ApJ, 697, 1369 [NASA ADS] [CrossRef] [Google Scholar]
- Bundy, K., Scarlata, C., Carollo, C. M., et al. 2010, ApJ, 719, 1969 [NASA ADS] [CrossRef] [Google Scholar]
- Cameron, E. 2011, PASA, accepted [arXiv:1012.0566] [Google Scholar]
- Cameron, E., Carollo, C. M., Oesch, P., et al. 2010, MNRAS, 409, 346 [NASA ADS] [CrossRef] [Google Scholar]
- Conselice, C. J. 2006, ApJ, 638, 686 [NASA ADS] [CrossRef] [Google Scholar]
- Conselice, C. J., Bershady, M. A., Dickinson, M., & Papovich, C. 2003, AJ, 126, 1183 [NASA ADS] [CrossRef] [Google Scholar]
- Conselice, C. J., Bundy, K., Trujillo, I., et al. 2007, MNRAS, 381, 962 [NASA ADS] [CrossRef] [Google Scholar]
- Conselice, C. J., Yang, C., & Bluck, A. F. L. 2009, MNRAS, 394, 1956 [NASA ADS] [CrossRef] [Google Scholar]
- Cool, R. J., Eisenstein, D. J., Fan, X., et al. 2008, ApJ, 682, 919 [NASA ADS] [CrossRef] [Google Scholar]
- Cortese, L., Boselli, A., Franzetti, P., et al. 2008, MNRAS, 386, 1157 [NASA ADS] [CrossRef] [Google Scholar]
- Cox, T. J., Primack, J., Jonsson, P., & Somerville, R. S. 2004, ApJ, 607, L87 [NASA ADS] [CrossRef] [Google Scholar]
- Cox, T. J., Jonsson, P., Primack, J. R., & Somerville, R. S. 2006, MNRAS, 373, 1013 [NASA ADS] [CrossRef] [Google Scholar]
- Cucciati, O., Marinoni, C., Iovino, A., et al. 2010, A&A, 520, A42 [NASA ADS] [CrossRef] [EDP Sciences] [Google Scholar]
- Daddi, E., Renzini, A., Pirzkal, N., et al. 2005, ApJ, 626, 680 [NASA ADS] [CrossRef] [Google Scholar]
- Darg, D. W., Kaviraj, S., Lintott, C. J., et al. 2010, MNRAS, 401, 1043 [NASA ADS] [CrossRef] [Google Scholar]
- De Propris, R., Liske, J., Driver, S. P., Allen, P. D., & Cross, N. J. G. 2005, AJ, 130, 1516 [NASA ADS] [CrossRef] [Google Scholar]
- De Propris, R., Conselice, C. J., Liske, J., et al. 2007, ApJ, 666, 212 [NASA ADS] [CrossRef] [Google Scholar]
- de Ravel, L., Le Fèvre, O., Tresse, L., et al. 2009, A&A, 498, 379 [NASA ADS] [CrossRef] [EDP Sciences] [Google Scholar]
- Domínguez-Palmero, L., & Balcells, M. 2008, A&A, 489, 1003 [NASA ADS] [CrossRef] [EDP Sciences] [Google Scholar]
- Driver, S. P., Liske, J., Cross, N. J. G., De Propris, R., & Allen, P. D. 2005, MNRAS, 360, 81 [NASA ADS] [CrossRef] [Google Scholar]
- Drory, N., & Alvarez, M. 2008, ApJ, 680, 41 [NASA ADS] [CrossRef] [Google Scholar]
- Drory, N., Salvato, M., Gabasch, A., et al. 2005, ApJ, 619, L131 [NASA ADS] [CrossRef] [Google Scholar]
- Efron, B. 1982 [Google Scholar]
- Eliche-Moral, M. C., Balcells, M., Aguerri, J. A. L., & González-García, A. C. 2006, A&A, 457, 91 [NASA ADS] [CrossRef] [EDP Sciences] [Google Scholar]
- Eliche-Moral, M. C., Prieto, M., Gallego, J., et al. 2010a, A&A, 519, A55 [NASA ADS] [CrossRef] [EDP Sciences] [Google Scholar]
- Eliche-Moral, M. C., Prieto, M., Gallego, J., & Zamorano, J. 2010b, ApJ, submitted [arXiv:1003.0686] [Google Scholar]
- Ellison, S. L., Patton, D. R., Simard, L., & McConnachie, A. W. 2008, AJ, 135, 1877 [NASA ADS] [CrossRef] [Google Scholar]
- Faber, S. M., Willmer, C. N. A., Wolf, C., et al. 2007, ApJ, 665, 265 [NASA ADS] [CrossRef] [Google Scholar]
- Fernández-Ontiveros, J. A., López-Sanjuan, C., Montes, M., Prieto, M. A., & Acosta-Pulido, J. A. 2011, MNRAS, 411, L21 [NASA ADS] [Google Scholar]
- Fisher, D. B., Drory, N., & Fabricius, M. H. 2009, ApJ, 697, 630 [NASA ADS] [CrossRef] [Google Scholar]
- Fontana, A., Santini, P., Grazian, A., et al. 2009, A&A, 501, 15 [NASA ADS] [CrossRef] [EDP Sciences] [Google Scholar]
- Franzetti, P., Scodeggio, M., Garilli, B., et al. 2007, A&A, 465, 711 [NASA ADS] [CrossRef] [EDP Sciences] [Google Scholar]
- Genel, S., Bouché, N., Naab, T., Sternberg, A., & Genzel, R. 2010, ApJ, 719, 229 [NASA ADS] [CrossRef] [Google Scholar]
- Giallongo, E., Salimbeni, S., Menci, N., et al. 2005, ApJ, 622, 116 [NASA ADS] [CrossRef] [Google Scholar]
- González-García, A. C., Oñorbe, J., Domínguez-Tenreiro, R., & Gómez-Flechoso, M. Á. 2009, A&A, 497, 35 [NASA ADS] [CrossRef] [EDP Sciences] [Google Scholar]
- Hopkins, P. F., Hernquist, L., Cox, T. J., Dutta, S. N., & Rothberg, B. 2008, ApJ, 679, 156 [NASA ADS] [CrossRef] [Google Scholar]
- Hopkins, P. F., Bundy, K., Murray, N., et al. 2009a, MNRAS, 398, 898 [NASA ADS] [CrossRef] [Google Scholar]
- Hopkins, P. F., Cox, T. J., Younger, J. D., & Hernquist, L. 2009b, ApJ, 691, 1168 [Google Scholar]
- Hopkins, P. F., Somerville, R. S., Cox, T. J., et al. 2009c, MNRAS, 397, 802 [NASA ADS] [CrossRef] [Google Scholar]
- Hopkins, P. F., Bundy, K., Croton, D., et al. 2010a, ApJ, 715, 202 [NASA ADS] [CrossRef] [Google Scholar]
- Hopkins, P. F., Bundy, K., Hernquist, L., Wuyts, S., & Cox, T. J. 2010b, MNRAS, 401, 1099 [NASA ADS] [CrossRef] [Google Scholar]
- Ilbert, O., Tresse, L., Zucca, E., et al. 2005, A&A, 439, 863 [NASA ADS] [CrossRef] [EDP Sciences] [Google Scholar]
- Ilbert, O., Arnouts, S., McCracken, H. J., et al. 2006, A&A, 457, 841 [NASA ADS] [CrossRef] [EDP Sciences] [Google Scholar]
- Ilbert, O., Salvato, M., Le Floc’h, E., et al. 2010, ApJ, 709, 644 [NASA ADS] [CrossRef] [Google Scholar]
- Jaech, J. L. 1964, JASA, 59, 863 [Google Scholar]
- Jiang, C. Y., Jing, Y. P., Faltenbacher, A., Lin, W. P., & Li, C. 2008, ApJ [Google Scholar]
- Jogee, S., Miller, S. H., Penner, K., et al. 2009, ApJ, 697, 1971 [NASA ADS] [CrossRef] [Google Scholar]
- Kaviraj, S., Schawinski, K., Devriendt, J. E. G., et al. 2007, ApJS, 173, 619 [NASA ADS] [CrossRef] [Google Scholar]
- Kaviraj, S., Khochfar, S., Schawinski, K., et al. 2008, MNRAS, 388, 67 [NASA ADS] [CrossRef] [Google Scholar]
- Kaviraj, S., Peirani, S., Khochfar, S., Silk, J., & Kay, S. 2009, MNRAS, 394, 1713 [NASA ADS] [CrossRef] [Google Scholar]
- Kaviraj, S., Tan, K., Ellis, R. S., & Silk, J. 2011, MNRAS, 411, 2148 [NASA ADS] [CrossRef] [Google Scholar]
- Kitzbichler, M. G., & White, S. D. M. 2008, MNRAS, 391, 1489 [NASA ADS] [CrossRef] [Google Scholar]
- Kormendy, J., & Kennicutt, Jr., R. C. 2004, ARA&A, 42, 603 [NASA ADS] [CrossRef] [Google Scholar]
- Le Fèvre, O., Abraham, R., Lilly, S. J., et al. 2000, MNRAS, 311, 565 [NASA ADS] [CrossRef] [Google Scholar]
- Le Fèvre, O., Saisse, M., Mancini, D., et al. 2003, in SPIE Conf. Ser. 4841, ed. M. Iye, & A. F. M. Moorwood, 1670 [Google Scholar]
- Le Fèvre, O., Mellier, Y., McCracken, H. J., et al. 2004, A&A, 417, 839 [NASA ADS] [CrossRef] [EDP Sciences] [Google Scholar]
- Le Fèvre, O., Guzzo, L., Meneux, B., et al. 2005a, A&A, 439, 877 [NASA ADS] [CrossRef] [EDP Sciences] [Google Scholar]
- Le Fèvre, O., Vettolani, G., Garilli, B., et al. 2005b, A&A, 439, 845 [NASA ADS] [CrossRef] [EDP Sciences] [Google Scholar]
- Lin, L., Koo, D. C., Willmer, C. N. A., et al. 2004, ApJ, 617, L9 [NASA ADS] [CrossRef] [Google Scholar]
- Lin, L., Patton, D. R., Koo, D. C., et al. 2008, ApJ, 681, 232 [NASA ADS] [CrossRef] [Google Scholar]
- Lin, L., Cooper, M. C., Jian, H., et al. 2010, ApJ, 718, 1158 [NASA ADS] [CrossRef] [Google Scholar]
- Lintott, C. J., Schawinski, K., Slosar, A., et al. 2008, MNRAS, 389, 1179 [NASA ADS] [CrossRef] [Google Scholar]
- Liske, J., Lemon, D. J., Driver, S. P., Cross, N. J. G., & Couch, W. J. 2003, MNRAS, 344, 307 [NASA ADS] [CrossRef] [Google Scholar]
- López-Sanjuan, C., Balcells, M., García-Dabó, C. E., et al. 2009a, ApJ, 694, 643 [Google Scholar]
- López-Sanjuan, C., Balcells, M., Pérez-González, P. G., et al. 2009b, A&A, 501, 505 [Google Scholar]
- López-Sanjuan, C., Balcells, M., Pérez-González, P. G., et al. 2010a, A&A, 518, A20 [NASA ADS] [CrossRef] [EDP Sciences] [Google Scholar]
- López-Sanjuan, C., Balcells, M., Pérez-González, P. G., et al. 2010b, ApJ, 710, 1170 [NASA ADS] [CrossRef] [Google Scholar]
- Lotz, J. M., Davis, M., Faber, S. M., et al. 2008, ApJ, 672, 177 [NASA ADS] [CrossRef] [Google Scholar]
- Lotz, J. M., Jonsson, P., Cox, T. J., & Primack, J. R. 2010a, MNRAS, 404, 590 [NASA ADS] [CrossRef] [Google Scholar]
- Lotz, J. M., Jonsson, P., Cox, T. J., & Primack, J. R. 2010b, MNRAS, 404, 575 [NASA ADS] [CrossRef] [Google Scholar]
- Maller, A. H., Katz, N., Kereš, D., Davé, R., & Weinberg, D. H. 2006, ApJ, 647, 763 [NASA ADS] [CrossRef] [Google Scholar]
- Martig, M., Bournaud, F., Teyssier, R., & Dekel, A. 2009, ApJ, 707, 250 [NASA ADS] [CrossRef] [Google Scholar]
- Masters, K. L., Nichol, R. C., Hoyle, B., et al. 2011, MNRAS, 411, 2026 [NASA ADS] [CrossRef] [Google Scholar]
- McCracken, H. J., Radovich, M., Bertin, E., et al. 2003, A&A, 410, 17 [NASA ADS] [CrossRef] [EDP Sciences] [Google Scholar]
- Mihos, J. C., & Hernquist, L. 1994, ApJ, 425, L13 [NASA ADS] [CrossRef] [Google Scholar]
- Naab, T., Jesseit, R., & Burkert, A. 2006, MNRAS, 372, 839 [NASA ADS] [CrossRef] [Google Scholar]
- Naab, T., Johansson, P. H., & Ostriker, J. P. 2009, ApJ, 699, L178 [NASA ADS] [CrossRef] [Google Scholar]
- Oesch, P. A., Carollo, C. M., Feldmann, R., et al. 2010, ApJ, 714, L47 [NASA ADS] [CrossRef] [Google Scholar]
- Patton, D. R., & Atfield, J. E. 2008, ApJ, 685, 235 [NASA ADS] [CrossRef] [Google Scholar]
- Patton, D. R., Carlberg, R. G., Marzke, R. O., et al. 2000, ApJ, 536, 153 [NASA ADS] [CrossRef] [Google Scholar]
- Patton, D. R., Pritchet, C. J., Carlberg, R. G., et al. 2002, ApJ, 565, 208 [NASA ADS] [CrossRef] [Google Scholar]
- Patton, D. R., Ellison, S. L., Simard, L., McConnachie, A. W., & Mendel, J. T. 2011, MNRAS, 412, 591 [NASA ADS] [CrossRef] [Google Scholar]
- Peng, Y., Lilly, S. J., Kovač, K., et al. 2010, ApJ, 721, 193 [NASA ADS] [CrossRef] [Google Scholar]
- Pozzetti, L., Bolzonella, M., Lamareille, F., et al. 2007, A&A, 474, 443 [NASA ADS] [CrossRef] [EDP Sciences] [Google Scholar]
- Pozzetti, L., Bolzonella, M., Zucca, E., et al. 2010, A&A, 523, A13 [NASA ADS] [CrossRef] [EDP Sciences] [Google Scholar]
- Rawat, A., Hammer, F., Kembhavi, A. K., & Flores, H. 2008, ApJ, 681, 1089 [NASA ADS] [CrossRef] [Google Scholar]
- Robaina, A. R., Bell, E. F., van der Wel, A., et al. 2010, ApJ, 719, 844 [NASA ADS] [CrossRef] [Google Scholar]
- Roseboom, I. G., Pimbblet, K. A., Drinkwater, M. J., et al. 2006, MNRAS, 373, 349 [NASA ADS] [CrossRef] [Google Scholar]
- Rothberg, B., & Fischer, J. 2010, ApJ, 712, 318 [NASA ADS] [CrossRef] [Google Scholar]
- Rothberg, B., & Joseph, R. D. 2006a, AJ, 131, 185 [NASA ADS] [CrossRef] [Google Scholar]
- Rothberg, B., & Joseph, R. D. 2006b, AJ, 132, 976 [NASA ADS] [CrossRef] [Google Scholar]
- Salim, S., Dickinson, M., Michael Rich, R., et al. 2009, ApJ, 700, 161 [NASA ADS] [CrossRef] [MathSciNet] [Google Scholar]
- Scarlata, C., Carollo, C. M., Lilly, S. J., et al. 2007, ApJS, 172, 494 [NASA ADS] [CrossRef] [Google Scholar]
- Schiminovich, D., Wyder, T. K., Martin, D. C., et al. 2007, ApJS, 173, 315 [NASA ADS] [CrossRef] [Google Scholar]
- Scodeggio, M., Franzetti, P., Garilli, B., et al. 2005, PASP, 117, 1284 [NASA ADS] [CrossRef] [Google Scholar]
- Scoville, N., Aussel, H., Brusa, M., et al. 2007, ApJS, 172, 1 [NASA ADS] [CrossRef] [Google Scholar]
- Sheth, K., Elmegreen, D. M., Elmegreen, B. G., et al. 2008, ApJ, 675, 1141 [NASA ADS] [CrossRef] [Google Scholar]
- Springel, V., White, S. D. M., Jenkins, A., et al. 2005, Nature, 435, 629 [NASA ADS] [CrossRef] [PubMed] [Google Scholar]
- Stewart, K. R., Bullock, J. S., Wechsler, R. H., & Maller, A. H. 2009, ApJ, 702, 307 [NASA ADS] [CrossRef] [Google Scholar]
- Taylor, E. N., Franx, M., Glazebrook, K., et al. 2010, ApJ, 720, 723 [NASA ADS] [CrossRef] [Google Scholar]
- Toft, S., Franx, M., van Dokkum, P., et al. 2009, ApJ, 705, 255 [NASA ADS] [CrossRef] [Google Scholar]
- Trujillo, I., Förster Schreiber, N. M., Rudnick, G., et al. 2006, ApJ, 650, 18 [NASA ADS] [CrossRef] [Google Scholar]
- Trujillo, I., Conselice, C. J., Bundy, K., et al. 2007, MNRAS, 382, 109 [NASA ADS] [CrossRef] [Google Scholar]
- Trujillo, I., Cenarro, A. J., de Lorenzo-Cáceres, A., et al. 2009, ApJ, 692, L118 [NASA ADS] [CrossRef] [Google Scholar]
- van der Wel, A. 2008, ApJ, 675, L13 [NASA ADS] [CrossRef] [Google Scholar]
- van der Wel, A., Holden, B. P., Zirm, A. W., et al. 2008, ApJ, 688, 48 [NASA ADS] [CrossRef] [Google Scholar]
- van Dokkum, P. G., Franx, M., Kriek, M., et al. 2008, ApJ, 677, L5 [NASA ADS] [CrossRef] [Google Scholar]
- van Dokkum, P. G., Whitaker, K. E., Brammer, G., et al. 2010, ApJ, 709, 1018 [NASA ADS] [CrossRef] [Google Scholar]
- Vergani, D., Scodeggio, M., Pozzetti, L., et al. 2008, A&A, 487, 89 [NASA ADS] [CrossRef] [EDP Sciences] [Google Scholar]
- Walcher, C. J., Lamareille, F., Vergani, D., et al. 2008, A&A, 491, 713 [NASA ADS] [CrossRef] [EDP Sciences] [Google Scholar]
- Wild, V., Walcher, C. J., Johansson, P. H., et al. 2009, MNRAS, 395, 144 [NASA ADS] [CrossRef] [Google Scholar]
- Williams, R. J., Quadri, R. F., Franx, M., van Dokkum, P., & Labbé, I. 2009, ApJ, 691, 1879 [NASA ADS] [CrossRef] [Google Scholar]
- Williams, R. J., Quadri, R. F., Franx, M., et al. 2010, ApJ, 713, 738 [NASA ADS] [CrossRef] [Google Scholar]
- Woods, D. F., & Geller, M. J. 2007, AJ, 134, 527 [NASA ADS] [CrossRef] [Google Scholar]
- Wyder, T. K., Martin, D. C., Schiminovich, D., et al. 2007, ApJS, 173, 293 [NASA ADS] [CrossRef] [Google Scholar]
- Zheng, X. Z., Bell, E. F., Papovich, C., et al. 2007, ApJ, 661, L41 [NASA ADS] [CrossRef] [Google Scholar]
- Zucca, E., Ilbert, O., Bardelli, S., et al. 2006, A&A, 455, 879 [NASA ADS] [CrossRef] [EDP Sciences] [Google Scholar]
- Zucca, E., Bardelli, S., Bolzonella, M., et al. 2009, A&A, 508, 1217 [NASA ADS] [CrossRef] [EDP Sciences] [Google Scholar]
Appendix A: Merger fraction fitting by generalized least squares
The dependence of the merger fraction fm ( ≥ μ) with μ is well described by a power-law function (Eq. (7)). However, our definition of fm is cumulative, so the points in Tables 1, 5 and 6 are not independent and their errors are correlated. To obtain reliable fit parameters and their uncertainties we used the Generalized Least Squares (GLS; Aitken 1935) method, which takes into account not only the variance of the data, but also the covariance between them. For a given and redshift range, we followed these steps to estimate the covariance matrix of the data:
-
1.
We extracted a random point, named
 , as drawn for a Gaussian distribution with mean
fm (μ ≥ 1/2) and standard deviation
σfm(μ ≥ 1/2).
In this process we imposed the criteria that the random point had to be positive,
i.e., negative merger fractions are nonphysical.
, as drawn for a Gaussian distribution with mean
fm (μ ≥ 1/2) and standard deviation
σfm(μ ≥ 1/2).
In this process we imposed the criteria that the random point had to be positive,
i.e., negative merger fractions are nonphysical. -
2.
To obtain the next merger fraction,
 , we extracted a random point as drawn for a
Gaussian with mean
fm (μ ≥ 1/3) − fm (μ ≥ 1/2)
and standard deviation
, we extracted a random point as drawn for a
Gaussian with mean
fm (μ ≥ 1/3) − fm (μ ≥ 1/2)
and standard deviation ![Mathematical equation: \hbox{$[\sigma^{2}_{f_{\rm m}}(\mu \geq 1/3) - \sigma^{2}_{f_{\rm m}}(\mu \geq 1/2)]^{1/2}$}](/articles/aa/full_html/2011/06/aa15839-10/aa15839-10-eq587.png) , and added it to the previous . In this process we set a negative random point
to zero, that is, we imposed that merger fractions are cumulative when
μ decreases. In addition, this process takes into account that
the errors are correlated.
, and added it to the previous . In this process we set a negative random point
to zero, that is, we imposed that merger fractions are cumulative when
μ decreases. In addition, this process takes into account that
the errors are correlated. -
3.
We repeated the step 2 for all the μ values under study down to μ = 1/10. This provided us a set of
 .
. 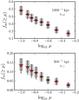
Fig. A.1 Merger fraction as a function of log 10 μ. We use these particular axis to facilitate the visualization. The dots and the error bars are the observational data. The gray areas are the 1σ confidence intervals of the simulated merger fractions, while the horizontal black lines are their mean (see text for details). Top panel: Merger fraction for
kpc at zr,2.
Bottom panel: Merger fraction for  kpc at zr,1. (A
colour version of this plot is available in electronic form.)
kpc at zr,1. (A
colour version of this plot is available in electronic form.) -
4.
We repeated 100 000 times steps 1–3 and estimated the covariance matrix of the observational merger fractions using the simulated ones.
are well described by a Gaussian, as desired. In Fig. A.1 we show the observational and the simulated merger fractions for kpc at zr,2 and for kpc at zr,1. We choose these two examples because they are the best and the worst simulated cases, respectively. Observational and simulated merger fractions are in agreement in the first case, but in the second case the values of the merger fraction are slightly overestimated (less than 5%), while the standard deviations are underestimated (less than 10%). To understand the origin of this discrepancy, we studied the distribution of  for both cases, Fig. A.2. In the first case the simulated distribution and that expected from observations are in excellent agreement. However, in the second case we find fewer points than expected at low values of the merger fraction. This is due to the lower values of the observed merger fraction at zr,1 and the higher errors for kpc measurements. This leads to negative random points, which we did not take into account (step 1) or set to zero (step 2), so we missed simulated values in the lower tail of the distribution. Despite this, the global simulated distribution is a good description of the expected one: if we only use the upper tail of the distribution to describe it, the difference between the observed and the simulated values of the merger fraction and its standard deviation becomes lower than 2% and 3%, respectively. Hence, we conclude that the simulated merger fractions describe well the observational ones and that the estimated covariance matrix is a good approximation to the real one.
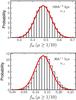 |
Fig. A.2 Probability distributions of the simulated merger fractions for μ > 1/10 and |
Using this covariance matrix, we applied the GLS to estimate fMM and s (Eq. (7)). We note that the errors in fMM are similar or higher than the errors in the observed major merger fractions, so we can not obtain new information of fMM from the GLS analysis. Hence, we set the value of fMM to the observed one and used GLS to estimate the power-law index s. To obtain reliable fits given the cumulative nature of the data, we opted to use the μ = 1/10 (lower μ value), μ = 1/4 (the fixed major merger fraction) and μ = 1/2 (higher μ value) data points, as we observed that, as expected, most of the slope information is contained in these three points (Jaech 1964). This produces a stable fit at every , as shown in Fig. A.3 for 50 h-1 kpc separations. Adding another five intermediate points only decreases the variance on s by 10–15% but is produces lower quality fits as shown in Fig. A.3 (i.e., the fitted curves depart more than 1σ from the observational data), which is caused by the increase in observational errors: analytically all the information is contained in a few μ points and the GLS does not take into account most of the data in the fit.
In summary, all the power-law index s values quoted in this paper were obtained from a GLS fit to μ = 1/10,1/4 and 1/2 merger fraction data, and using simulated merger fractions to estimate their covariance matrices.
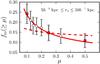 |
Fig. A.3 Generalized least squares fit to all the data (dashed line) and to the squares (μ = 1/10,1/4 and 1/2; solid line). Observed merger fractions are for |

All Tables
Merger fraction of , red (MNUV − Mr ≥ 4.25) galaxies as a function of luminosity ratio μ for kpc.
Merger fraction of , blue (MNUV − Mr < 4.25) galaxies as a function of luminosity ratio μ for kpc.
All Figures
|
Fig. 1 B-band absolute magnitude versus redshift for all the VVDS-Deep sources with zspec ≤ 1.2. Vertical solid lines identify the redshift intervals in our study, named zr,1 = [0.2,0.65) and zr,2 = [0.65,0.95). The horizontal solid line represents the selection of the principal galaxy sample, MB,1 ≤ −20 − 1.1z. The dashed line shows the limit of the companion sample down to μ ≥ 1/10, MB,2 ≤ − 17.5 − 1.1z, while the dash-dotted line shows that we are complete in both redshift bins when we search for μ ≥ 1/5 companions, MB,2 ≤ − 18.25 − 1.1z. (A colour version of this plot is available in electronic form.) |
| In the text | |
|
Fig. 2 Merger fraction versus luminosity ratio in B-band, μ, for close pairs with |
| In the text | |
|
Fig. 3 Power-law index s versus |
| In the text | |
|
Fig. 4 Major merger fraction, fMM, versus |
| In the text | |
|
Fig. 5 Minor (squares), major (dots), and major + minor (triangles) merger fraction of |
| In the text | |
|
Fig. 6 Number density (gray scales) of |
| In the text | |
|
Fig. 7 Merger fraction versus luminosity ratio in B-band, μ. Stars, triangles and inverted triangles are the merger fraction of red primaries, |
| In the text | |
|
Fig. 8 Merger rate of |
| In the text | |
|
Fig. A.1 Merger fraction as a function of log 10 μ. We
use these particular axis to facilitate the visualization. The dots and the
error bars are the observational data. The gray areas are the
1σ confidence intervals of the simulated merger fractions,
while the horizontal black lines are their mean (see text for details).
Top panel: Merger fraction for |
| In the text | |
|
Fig. A.2 Probability distributions of the simulated merger fractions for μ > 1/10 and |
| In the text | |
|
Fig. A.3 Generalized least squares fit to all the data (dashed line) and to the squares (μ = 1/10,1/4 and 1/2; solid line). Observed merger fractions are for |
| In the text | |
Current usage metrics show cumulative count of Article Views (full-text article views including HTML views, PDF and ePub downloads, according to the available data) and Abstracts Views on Vision4Press platform.
Data correspond to usage on the plateform after 2015. The current usage metrics is available 48-96 hours after online publication and is updated daily on week days.
Initial download of the metrics may take a while.