Fig. A.1
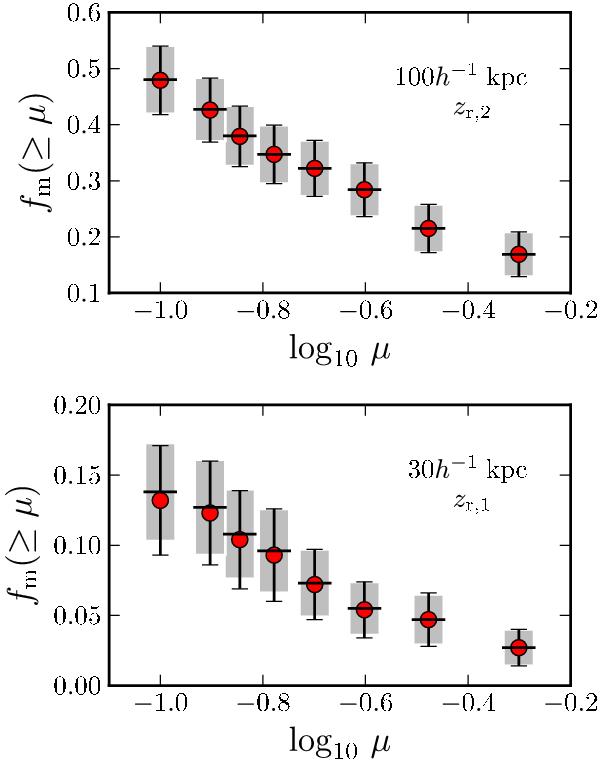
Merger fraction as a function of log 10 μ. We
use these particular axis to facilitate the visualization. The dots and the
error bars are the observational data. The gray areas are the
1σ confidence intervals of the simulated merger fractions,
while the horizontal black lines are their mean (see text for details).
Top panel: Merger fraction for  kpc at zr,2.
Bottom panel: Merger fraction for
kpc at zr,2.
Bottom panel: Merger fraction for  kpc at zr,1. (A
colour version of this plot is available in electronic form.)
kpc at zr,1. (A
colour version of this plot is available in electronic form.)
Current usage metrics show cumulative count of Article Views (full-text article views including HTML views, PDF and ePub downloads, according to the available data) and Abstracts Views on Vision4Press platform.
Data correspond to usage on the plateform after 2015. The current usage metrics is available 48-96 hours after online publication and is updated daily on week days.
Initial download of the metrics may take a while.