Fig. 8
Merger rate of  galaxies versus redshift. Dots are the major merger rate (μ ≥ 1/4), squares are the minor merger rate (1/10 ≤ μ < 1/4), and triangles are the total (major + minor, μ ≥ 1/10) merger rate. The points are shifted when necessary to avoid overlap. The z error bars in the total merger rate mark the redshift range spanned by VVDS-Deep data. The inverted triangle is the major merger rate of
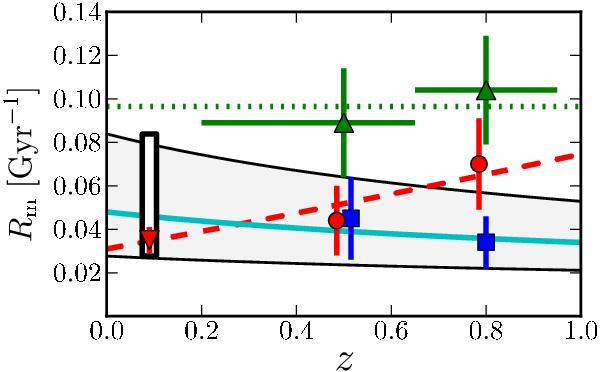
  galaxies from MGC at z = 0.09. The white rectangle identifies the local (z = 0.09) minor merger fraction estimated from the total and the major merger ones, while the gray area marks the most probable minor merger rate values in the range 0 < z < 1 (see text for details). The solid line is the best fit of a power-law function with a fixed index, fmm ∝ (1 + z)-0.5, to the minor merger rate data. The dashed line is the least-squares fit of a power-law function to the major merger rate data. The dotted line represents a constant major + minor merger rate. (A colour version of this plot is available in electronic form.)
Current usage metrics show cumulative count of Article Views (full-text article views including HTML views, PDF and ePub downloads, according to the available data) and Abstracts Views on Vision4Press platform.
Data correspond to usage on the plateform after 2015. The current usage metrics is available 48-96 hours after online publication and is updated daily on week days.
Initial download of the metrics may take a while.