| Issue |
A&A
Volume 530, June 2011
|
|
|---|---|---|
| Article Number | A150 | |
| Number of page(s) | 18 | |
| Section | Galactic structure, stellar clusters and populations | |
| DOI | https://doi.org/10.1051/0004-6361/201015248 | |
| Published online | 27 May 2011 | |
XMM-Newton observations of the young open cluster around λ Orionis⋆,⋆⋆
1
INAF – Osservatorio Astrofisico di Arcetri, Largo E. Fermi 5, 50125 Florence, Italy
e-mail: This email address is being protected from spambots. You need JavaScript enabled to view it.
2 Chester F. Carlson Center for Imaging Science, Rochester Institute of Technology, 54 Lomb Memorial Drive, 14623 Rochester, USA
Received: 21 June 2010
Accepted: 30 March 2011
Abstract
Aims. We studied the X-ray properties of the young (~1−8 Myr) open cluster around the hot (O8 III) star λ Ori and compared them with those of the similarly-aged σ Ori cluster to investigate possible effects of the different ambient environment.
Methods. We analysed an XMM-Newton observation of the cluster using EPIC imaging and low-resolution spectral data. We studied the variability of detected sources, and performed a spectral analysis of the brightest sources in the field using multi-temperature models.
Results. We detected 167 X-ray sources, of which 58 are identified with known cluster members and candidates, from massive stars down to low-mass stars with spectral types ~M5.5. Another 23 sources were identified with new possible photometric candidates. Late-type stars have a median log LX/Lbol ~ −3.3, close to the saturation limit. Variability was observed in ~35% of late-type members or candidates, including six flaring sources. The emission from the central hot star λ Ori is dominated by plasma at 0.2 − 0.3 keV, with a weaker component at 0.7 keV, consistently with a wind origin. The coronae of late-type stars can be described by two plasma components with temperatures T1 ~ 0.3−0.8 keV and T2 ~ 0.8−3 keV, and subsolar abundances Z ~ 0.1−0.3 Z⊙, similar to what is found in other star-forming regions and associations. No significant difference was observed between stars with and without circumstellar discs, although the smallness of the sample of stars with discs and accretion does not allow us to draw definitive conclusions.
Conclusions. The X-ray properties of λ Ori late-type stars are comparable to those of the coeval σ Ori cluster, suggesting that stellar activity in λ Ori has not been significantly affected by the different ambient environment.
Key words: open clusters and associations: individual:λOrionis / stars: activity / stars: coronae / stars: late-type / stars: pre-main sequence / X-rays: stars
Based on observations obtained with XMM-Newton, an ESA science mission with instruments and contributions directly funded by ESA Member States and NASA.
Appendix is available in electronic form at http://www.aanda.org
© ESO, 2011
1. Introduction
The λ Ori cluster (Collinder 69), located at a distance of about 400 pc (Murdin & Penston 1977; Mayne & Naylor 2008), consists of a group of ~10 OB stars and ~200 late-type pre-main sequence (PMS) stars concentrated within 1 deg of the O8 III + B0 V binary λ Ori AB. The cluster lies at the centre of an H ii region delimited by a dense ring of molecular gas and dust with a 9 deg diameter (Maddalena & Morris 1987; Zhang et al. 1989). Based on an extensive optical photometric and medium-resolution spectroscopic survey of the entire region, Dolan & Mathieu (1999, 2001, 2002) suggested that star formation in the region started ~6−8 Myr ago, and was interrupted ~1−2 Myr ago by a supernova explosion which dispersed the parent gas cloud, creating the molecular ring, and unbound the cluster. They also found that the fraction of classical T Tauri stars belonging to the λ Ori cluster was only ~7%, significantly lower than other clusters and star-forming regions (SFRs) of similar age, and suggested that circumstellar discs might have been photoevaporated by the far-UV radiation of the hot stars before the supernova explosion, when low-mass and OB stars were still confined by the parent cloud in a smaller region. Spitzer imaging by Barrado y Navascués et al. (2007) showed that only ~30% of low-mass cluster members have circumstellar discs. Sacco et al. (2008) compared the disc and accretion properties of low-mass stars in λ Ori with those of the similarly-aged cluster σ Ori, finding that not only the fraction of stars with discs, but also the fraction of discs that are actively accreting is significantly lower in λ Ori than in σ Ori. These authors suggested that the observed discrepancy might be due either to the effect of the massive stars and the supernova explosion, or to an older age of the λ Ori cluster with respect to σ Ori, although no definitive conclusion could be drawn from the available data.
An interesting question to answer is whether the supernova explosion and the different ambient environment might have affected the magnetic activity of PMS stars in the λ Ori cluster. To investigate this issue, we performed an X-ray observation of the λ Ori cluster using the XMM-Newton satellite. The observation was centred on the hot star λ Ori AB, in order to obtain both a high-resolution RGS spectrum of the central source and EPIC imaging data and low-resolution spectra over the whole field of view. A detailed analysis of the RGS spectrum of λ Ori AB will be presented in a forthcoming paper. Here we concentrate on the analysis of the EPIC data, to derive the X-ray properties of the cluster population; we will then compare the results with those obtained with XMM-Newton for the σ Ori cluster by Franciosini et al. (2006, hereafter FPS06) to investigate possible differences between the two clusters.
The λ Ori region was first observed in X-rays with Einstein, which found five X-ray sources, one identified with the hot star λ Ori (Stone & Taam 1985). The ROSAT All-Sky Survey detected several X-ray sources identified with new T Tauri stars (Sterzik et al. 1995; Neuhäuser et al. 1995, 1997; Alcalá et al. 1996; Magazzu et al. 1997). The central hot star was observed with ASCA by Corcoran et al. (1994) who found a hard spectrum with temperatures of 0.3 and 2.3 keV. Recently, Barrado et al. (2011) has performed an XMM-Newton observation of two fields to the east and west of the cluster centre, partially overlapping our observation. However, a detailed X-ray study of the central region of the cluster has not been done before. Our observations represent the first comprehensive analysis of the X-ray properties of the low-mass population located around the hot star λ Ori.
The paper is organised as follows. The X-ray observations and data analysis are described in Sect. 2. In Sects. 3 and 4 we present the results of the variability and spectral analysis, while in Sect. 5 we discuss the X-ray luminosities of cluster members and candidates. In Sect. 6 we compare our results with those obtained for the σ Ori cluster. Conclusions are given in Sect. 7.
2. Observations and data analysis
The λ Ori cluster was observed by XMM-Newton from 20:46 UT on September 28, 2006 to 12:23 UT on September 29, 2006 (Obs. ID 0402050101), for a total duration of 56 ks, using both the EPIC MOS and PN cameras and the RGS instruments. The EPIC cameras were operated in full frame mode with the thick filter.
Data analysis was carried out using the standard tasks in SAS v.7.1.0. The PN data were time-filtered to exclude a period of high background due to proton flares at the end of the observation. The final effective exposure time was ~55 ks for each MOS and ~53 ks for PN. We limited our analysis to the 0.3 − 7.8 keV energy band to exclude low-energy events, which are mostly noise and artifacts, and the background, which dominates the emission above 7.8 keV. The image of the combined MOS1+MOS2+PN events in the 0.3 − 7.8 keV energy band is shown in Fig. 1.
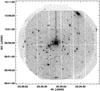 |
Fig. 1 Composite EPIC MOS1+MOS2+PN image of the λ Ori field in the 0.3 − 7.8 keV energy band. |
2.1. Source detection
Source detection was performed both on the individual datasets and on the merged MOS1+MOS2+PN dataset using the wavelet detection algorithm developed at INAF – Osservatorio Astronomico di Palermo (Damiani et al. 1997), adapted to the EPIC case. The EPIC version was specifically designed to handle in a straightforward way source detection on the sum of datasets from different instruments. We used a detection threshold of 5σ, which ensures at most one spurious detection in each dataset, and which was determined from a set of 100 Monte-Carlo simulations of pure background datasets with the same number of counts as the observation. To take the different sensitivities of the PN and MOS cameras into account, in the detection on the summed dataset we scaled the PN exposure map by a factor of 3.1, derived from the median ratio of PN to MOS count rates of common sources detected on the individual datasets. Count rates derived from the detection on the summed dataset are expressed as MOS equivalent count rates.
After removing a few obviously spurious detections (due to hot pixels, to the point spread function structure of the central bright source, to out-of-time events, or to sources split by CCD gaps), we obtained a total of 167 sources, three of which were only detected on a single instrument. To check for systematic offsets in the derived X-ray coordinates, we cross-correlated the source list with the 2MASS catalogue (Skrutskie et al. 2006), using an identification radius of 6 arcsec. We found a median offset between the X-ray and optical positions of − 1.8 arcsec in right ascension and − 0.2 arcsec in declination. This offset was then used to correct the X-ray coordinates before performing the source identification. The detected sources with the corrected X-ray coordinates are listed in Table A.1, where we also indicate their counterparts identified in Sect. 2.4.
2.2. Extraction and analysis of light curves and spectra
For all sources we extracted light curves from the MOS and PN event files, using circular regions with radii ranging between 24″ for the brightest, isolated sources, down to 10″ for very close sources to avoid mutual contamination. To investigate the source variability, we applied a Kolmogorov-Smirnov test on the unbinned photon arrival times for the combined PN and MOS data. To this aim, we selected only events occurring in the “good time intervals” in common between all instruments. For sources falling on CCD gaps or close to the CCD edges in one of the instruments, we excluded data from that instrument to avoid possible spurious effects. The results of the variability analysis are discussed in Sect. 3.
Spectral analysis was performed for sources with at least 500 counts in the PN, or in the MOS if PN was not available. PN and MOS spectra were extracted from the same circular regions used for the light curves. We excluded from the analysis the sources located on the point-spread-function wings of λ Ori AB, since their spectra below 1 keV are strongly contaminated by the emission from the central hot star. In a few cases we also excluded spectra from either the PN or the MOS cameras for sources located on a CCD gap or at the CCD edge of the instrument, since the effective number of source counts from that instrument is considerably reduced. The only exception was made for source LOX 1, which falls close to the edge of the PN detector but is outside the field of view of both MOS cameras. Background spectra were extracted from nearby circular regions free from other X-ray sources and on the same CCD chip, using the same extraction radius as the corresponding source region. Response matrices and ancillary files were generated for each source using the standard SAS tasks rmfgen and arfgen. Spectra were rebinned to a minimum of 20 counts per bin and were fitted in XSPEC v.12.5.0. For each source, we performed joint fits of the available PN and MOS spectra using the APEC v.1.3.0 thermal plasma model with one or more temperature components, and the WABS model to account for interstellar absorption. Abundances were left free to vary, and values are relative to the solar abundances by Anders & Grevesse (1989). Errors for each parameter were computed for Δχ2 = 2.706.
To investigate the nature of fainter sources, we also computed hardness ratios for all sources, using background-subtracted counts extracted from the same circular regions defined above. Counts were extracted from the PN dataset (or MOS for sources outside the PN field of view or on CCD gaps) in the following energy bands: 0.3−1.0 keV (soft, S), 1.0−2.4 keV (medium, M) and 2.4 − 7.8 keV (hard, H). Hardness ratios were then defined as HR1 = (M − S)/(M + S) and HR2 = (H − M)/(H + S). This choice allows us to distinguish between stellar sources, which are generally soft and emit most of their luminosity below ~1 keV, and highly-absorbed extragalactic sources, whose emission would mainly be in the higher-energy bands.
X-ray and optical properties of sources identified with known cluster members and candidates.
2.3. Optical catalogue
To identify the detected sources, we constructed an optical catalogue of known objects in the XMM-Newton field of view from the literature. Dolan & Mathieu (1999, 2001, 2002) performed an extensive photometric and medium-resolution spectroscopic survey of the entire SFR, finding a total of 266 late-type members, 72 of which were located in the central 1 deg region around λ Ori. Barrado y Navascués et al. (2004, 2007), using deep optical/infrared photometry, low-resolution spectroscopy, and Spitzer imaging, extended the known cluster population to very-low mass stars and brown dwarfs, finding ~50 members and photometric candidates down to ~0.02 M⊙. High-resolution spectroscopy by Sacco et al. (2008) and Maxted et al. (2008) provided accurate membership information for ~90 low-mass candidates. Recently, Bouy et al. (2009) performed a deep near-infrared survey of the central 5 arcmin of the cluster, finding nine new very low-mass member candidates and a faint visual companion to λ Ori C. We added additional bright stars from the photometric study by Murdin & Penston (1977) and from the X-ray study by Stone & Taam (1985). Proper motion membership for bright stars is provided by Dias et al. (2001) and Kharchenko et al. (2004). Most of the stars in the catalogue, with the exception of a few faint objects, have 2MASS counterparts, so we used their 2MASS coordinates to have more accurate positions.
The final catalogue contains 153 stars falling in the XMM-Newton field of view, 128 of which are probable or possible cluster members. 85 late-type members are spectroscopically-confirmed, showing both the presence of youth indicators (strong Li i and/or weak Na i absorption lines), as well as radial velocity consistent with that of the cluster (Dolan & Mathieu 1999; Sacco et al. 2008; Maxted et al. 2008). Six of the cluster members are early-type (O-B-A) stars, including the O8 III and B0 V components of λ Ori AB, and the Herbig Ae/Be (HAeBe) star HD 245185. Spitzer data are available for five of the early-type members (Hernández et al. 2009), and for 93 of the late-type members and candidates (Barrado y Navascués et al. 2007), among which 33 have optically thick (Class II) or evolved, optically thin discs (EV). However, only nine of the stars with discs in our sample are known to be accreting from spectroscopic observations.
For all cluster members and candidates we derived masses, ages, and bolometric luminosities from the available colour–magnitude diagrams, using the Siess et al. (2000) evolutionary tracks with the Kenyon & Hartmann (1995) colour transformations for stars brighter than Ic ~ 16 mag, and the Baraffe et al. (1998) tracks for fainter stars. We used primarily the I vs. (R − I) diagram for brighter stars, and the I vs. (I − J) diagram for faint stars. For a few very-low mass stars and brown dwarfs falling outside the model grids, we estimated the masses and luminosities from the J (or Ks) magnitude assuming an age of 5 Myr; similarly, we used the V magnitude and the spectral type to estimate the mass and luminosity of λ Ori C for the same age. For λ Ori AB, the mass and luminosity were taken from Dolan & Mathieu (2001).
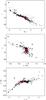 |
Fig. 2 I vs. (R − I) colour–magnitude diagram (top panel), J vs. (J − Ks) colour–magnitude diagram (middle panel), and (J − Ks) vs. (I − J) colour–colour diagram (bottom panel) for objects in the XMM-Newton field of view. Filled and open circles indicate detected and undetected members and candidates, respectively, while red diamonds indicate the possible new candidates detected in our observation. Detected non-members are marked as blue crosses; the boxed cross symbol indicates HD 245059, discussed in Sect. 4.3. The solid and dashed lines are 1, 5, 10, and 20 Myr isochrones from Siess et al. (2000) and Baraffe et al. (1998). The star with strong (J − Ks) excess is the HAeBe star HD 245185. |
2.4. Source identification
We cross-correlated the X-ray source list with the optical catalogue using a search radius of 4 arcsec. This radius was determined by constructing the cumulative distribution of the offsets between X-ray and optical position, following Randich & Schmitt (1995); with this value, we expected to have at most three spurious identifications. We found 67 sources with at least one optical counterpart in our catalogue, 58 of which were identified with cluster members or candidates (indicated with “Member” in Table A.1). Three sources were identified with early-type members with M > 2 M⊙: λ Ori AB (the two components are too close to be resolved by XMM-Newton), the B9 star HD 245140, and the HAeBe star HD 245185. We detected ~60% (9/15) of the stars with M = 1.0−2.0 M⊙, and ~74% of stars between 0.25 and 1.0 M⊙ (43/58). Only three of the 58 objects with M < 0.25 M⊙ were detected, LOri 083, LOri-SOC-1, and LOri-SOC-2, with masses of 0.16 − 0.24 M⊙ and X-ray luminosities of ~8 × 1028 erg s-1. The X-ray and optical properties of the sources identified with cluster members and candidates are listed in Table 1.
One of the sources, LOX 70, identified with the F8V star λ Ori C, has another faint counterpart within the identification radius, LOri-MAD-30. This object was recently discovered by Bouy et al. (2009) as a close, very-low mass visual companion to λ Ori C. Assuming it belongs to the cluster, they estimate a mass of ~0.04 M⊙ for an age of 5 Myr from its magnitude (Ks = 14.75 mag), i.e. it would be a candidate brown dwarf. The X-ray emission from such a very-low mass object is expected to fall below the detection limit (see Sect. 5 and Fig. 7), and it would therefore be more than one order of magnitude lower than the observed count rate. LOX 70 underwent a flare during the observation with an increase in the count rate by more than a factor of 2 (see Sect. 3). Unfortunately, the strong contamination from λ Ori AB hides the quiescent emission level of the source, preventing a definitive conclusion about the origin of the X-ray emission. However, since the luminosity of LOX 70 is consistent with that of other stars of masses similar to λ Ori C (~2 M⊙), we believe it more likely that the observed emission is associated with the F8 star. Therefore, we have assigned all the observed flux to λ Ori C.
For the remaining 71 undetected cluster members and candidates we computed 3σ upper limits at the optical positions using the wavelet algorithm; their optical and X-ray properties are given in Table A.2. The location of detected and undetected cluster members in the I vs. (R − I) and J vs. (J − Ks) colour–magnitude diagrams, and in the (J − Ks) vs. (I − J) colour–colour diagram is shown in Fig. 2.
The other nine sources were identified with cluster non-members (indicated with NM in Table A.1). Three of them (LOX 7 = LOri 046, LOX 20 = LOri 036, and LOX 45 = LOri 020) show no evidence of strong Li i absorption and are likely field stars (Sacco et al. 2008). Additional four stars (LOX 2 = LOri 044, LOX 3 = LOri 052, LOX 14 = HD 245059, and LOX 30 = DM 20) show signatures of youth (strong Li i absorption and/or low-gravity lines) but have radial velocity inconsistent with membership (Alcalá et al. 2000; Dolan & Mathieu 1999; Maxted et al. 2008); HD 245059 also has a proper motion inconsistent with membership according to Dias et al. (2001) and Kharchenko et al. (2004) and is located significantly above the cluster sequence in colour–magnitude diagrams. The remaining two objects (LOX 64 = TYC 705-860-1 and LOX 113 = TYC 705-937-1) are located significantly above the cluster sequence, and we consider them as probable photometric non-members.
X-ray sources identified with possible new cluster candidates.
We cross-correlated the source list also with the 2MASS and the Dolan & Mathieu (2002) catalogues, finding counterparts for additional 28 X-ray sources, with two possible identifications within 4 arcsec in the case of source LOX 150. All the counterparts were found in the 2MASS catalogue, and 15 of them have also optical photometry from Dolan & Mathieu (2002). Among these objects, 23 have photometry that is consistent with the cluster sequence in optical and infrared colour–magnitude diagrams and colour-colour diagrams, as shown in Fig. 2, therefore we classify them as possible new candidate members. We list their properties in Table 2, and the other identifications are indicated in Table A.1.
The two counterparts of LOX 150 are located at 1.1 and 2.8 arcsec from the X-ray source. These two objects are very similar with comparable magnitudes and estimated masses of ~ 0.1−0.2 M⊙. From the inspection of the X-ray image, it is not possible to determine whether the bulk of the emission is associated with only one of the two stars or if both contribute to the source in a comparable way. Therefore, for the following analysis we divided the X-ray flux equally between them.
To increase the number of identifications, we also searched all available catalogues in the VizieR database 1, finding counterparts for an additional 12 sources. Five sources have counterparts in the USNO-B1.0 catalogue, six identifications are found in the Guide Star Catalogue 2.3 (GSC2.3), all classified as non-stellar objects, and the remaining one is the radio source 4C 09.21 (Day et al. 1966; Williams et al. 1968). We list these identifications also in Table A.1. The remaining 60 sources have no known counterpart in any astronomical catalogue. It is likely that most of them are background extragalactic objects. We estimated the expected number of extragalactic X-ray sources in our observation using the studies by Tozzi et al. (2001) and Alexander et al. (2003). Considering that the sensitivity of our observation ranges from 0.2 cts ks-1 in the centre of the field to 0.7 cts ks-1 in the outer regions, and assuming a power-law spectrum with Γ = 1.4 and a Galactic absorption of 2 × 1021 cm-2 towards λ Ori, we expect ~65−80 extragalactic X-ray sources in our observation, in agreement with the number of unidentified sources.
To further check the nature of unidentified sources, in Fig. 3 we plot the hardness ratios for all detected sources. As expected, all known cluster members and candidates show soft spectra with HR1 ≲ 0.2 and HR2 < 0. Similar hardness ratios are found for known cluster non-members and for all the new candidates except one. On the other hand, most of the sources with USNO-B1/GSC2.3 identification or without identification have HR1 > 0.2, indicating harder spectra and supporting their identification with extragalactic objects.
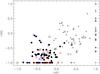 |
Fig. 3 Hardness ratios HR2 vs. HR1 for all detected sources. We indicate with different symbols cluster members and candidates (filled circles), new candidates (red diamonds), previously known non-members (blue crosses), other sources with counterparts in 2MASS (open squares) or in other catalogues (triangles) and sources without counterparts (pluses). |
As mentioned above, one of the new candidates, LOX 34, shows a significantly harder emission, with HR1 = 0.85 and HR2 = −0.17. This object is classified as stellar in the GSC2.3 catalogue and is too bright (R = 17.1 mag, I = 14.9 mag) to be an extragalactic object. Its position in the J vs. (J − Ks) and (J − Ks) vs. (I − J) diagrams indicates the presence of infrared excess. The source is too faint to perform a reliable spectral analysis (~160 counts in PN); however, its PN spectrum appears to be consistent with a highly-absorbed coronal source with a temperature of ~1 keV, similar to the values found for cluster members (see Sect. 4). The high value of HR1 is a consequence of the high absorption that strongly reduces the observed emission below 1 keV. Therefore, we believe that LOX 34 might be a cluster member observed through a significant amount of circumstellar material (maybe an edge-on disk?). Optical spectroscopic observations will be required to confirm its nature.
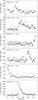 |
Fig. 4 Combined PN+MOS1+MOS2 light curves of cluster members and candidates showing strong flares during our observation. Count rates are expressed as MOS equivalent count rates. The different bin size used for each source is indicated at the top of each panel together with the source identification. |
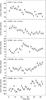 |
Fig. 5 Same as Fig. 4 but for the brightest cluster members and candidates showing gradual variations or variability not clearly attributable to flares. |
3. Variability
Many of the sources showed significant variability during our observation, mostly in the form of flares or low-level, irregular variability, as well as gradual variations over the whole observations. The Kolmogorov-Smirnov test indicated variability at the 99% confidence level in 18/58 (31%) cluster members and in 8/23 (35%) new candidates. An additional two cluster members were variable at the 95% level. All variable sources are late-type objects, with the exception of the B9 star LOX 46 = HD 245140, which showed the onset of a strong flare just before the end of the observation. Significant flares were observed in additional five sources, including one of the new candidates (LOX 79). The combined PN+MOS1+MOS2 light curves of these sources are shown in Fig. 4. These flares show the typical flare behaviour, commonly observed in active late-type stars, with a fast rise over ~2−5 ks followed by a slower decay of ~10−20 ks, and increases in the count rate by factors of ~ 2.5 − 10.
As mentioned in Sect. 2.4, in the case of the F8 star LOX 70 = λ Ori C, which lies on the wings of λ Ori AB, the observed emission is strongly contaminated by the hot star. Therefore, a significant fraction (if not all) of the steady emission level observed outside of the flare is likely due to the contribution from λ Ori AB. However, since the emission from the hot star is steady throughout the entire observation, the flare can be entirely attributed to LOX 70. Unfortunately, the fact that the intrinsic quiescent level of LOX 70 is not known does not allow us to determine the true strength and duration of the flare.
In Fig. 5 we plot the light curves of sources showing gradual variations in the X-ray emission level that are not clearly attributable to flares. Two of them (LOX 17 and LOX 67) show a maximum at the beginning of the observation followed by decay by a factor of ~2, which could either represent the decay phase of a moderate flare or modulation of the emission due to stellar rotation. Another source (LOX 166) shows a gradual rise by a factor of 2 in ~15 ks, while LOX 81 shows an increase in the emission level by a factor of ~3 with comparable rise and decay times of 15 − 20 ks. Finally, LOX 98, identified with a new candidate, shows a sharp increase by a factor of ~1.5 followed by a nearly steady median emission level. Similar trends are commonly observed in PMS stars (FPS06; Preibisch & Zinnecker 2002; Skinner et al. 2003; Favata et al. 2005; Ozawa et al. 2005; Franciosini et al. 2007; Getman et al. 2008; Caballero et al. 2010), and can be interpreted as modulation of the emission from active or flaring regions unevenly distributed on the stellar surface and rotating in and out of view (Stelzer et al. 1999).
4. Spectral analysis
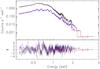 |
Fig. 6 PN (black) and MOS (red and blue) spectra of λ Ori AB, together with the best-fit model. |
4.1. λ Ori AB
The hot star λ Ori AB (LOX 71) is the strongest source in the centre of the field of view. Its PN and MOS spectra are shown in Fig. 6. The spectrum is soft, with the emission falling below the background level above ~4 keV. We fitted the spectra using three temperature components and variable individual abundances, and the hydrogen column density NH was left free to vary. The third component was required to fit the higher energy part of the spectrum, which was slightly underestimated above 2 keV using only two temperatures.
The resulting best-fit parameters are given in Table 3. The column density is consistent with the value NH = 7.4 × 1020 cm-2 derived from the cluster reddening E(B − V) = 0.12 mag (Diplas & Savage 1994) using the standard relation NH/AV = 2 × 1021 cm-2 mag-1 (Vuong et al. 2003, and references therein). The bulk of the emission is concentrated at temperatures of ~0.2−0.3 keV (2−3 MK), with equal emission measures. A much weaker component is present at ~0.7 keV (8 MK). Abundances are subsolar, ranging between 0.3 and 0.5 of the solar values. These results are consistent with those found for the O9.5V star σ Ori AB, although the third component at 0.7 keV was not present in this star (Sanz-Forcada et al. 2004; Skinner et al. 2008), and for other hot stars (e.g. Zhekov & Palla 2007; Cohen et al. 2008; Nazé 2009). The unabsorbed X-ray luminosity of λ Ori AB in the 0.3−8.0 keV band is LX = 1.2 × 1032 erg s-1.
The star λ Ori AB was previously observed with ASCA by Corcoran et al. (1994), who found a significantly hotter spectrum, with a component at ~2.3 keV (~25 MK) in addition to the cooler emission at 0.3 keV (3 MK), and an iron abundance of ~0.2 solar. We do not find any evidence of such a hot plasma in our observation. However, the ASCA spectrum was extracted from a region of 4′ radius: as shown in Fig. 1, there are several bright sources around λ Ori AB falling within this radius. If we extract a combined spectrum of the central hot star and all the other sources included in the ASCA extraction region, a hot tail appears, requiring a plasma component at ~ 2.5 keV (30 MK). We therefore conclude that the hot plasma inferred from the ASCA data was not a property of the hot star itself, but the result of contamination of its spectrum by the unresolved hotter sources close to it.
Result of the joint PN and MOS spectral fitting for the hot star λ Ori AB and for the non-member weak-lined T Tauri star HD 245059.
Best-fit parameters from the joint PN and MOS spectral fits for bright cluster members and two new candidates.
4.2. Other cluster members and candidates
Apart from λ Ori AB, the sample selected for spectral analysis includes 17 cluster members and candidates, all of which are late-type stars, except for the B9 star LOX 46 (HD 245140). Only one of the stars in the sample, LOX 100 (DM 33), is a Class II star with active accretion. Two of the selected sources, LOX 31 and 87, showed flares during the observation; however, their count rates are too low to perform a time-dependent analysis, so only the spectrum for the entire observation was fitted. In addition, spectral analysis was also performed for two of the 2MASS candidates (LOX 98 and 109).
All the spectra were fitted with a 2-temperature model with variable global abundance. In two cases, only one temperature component was enough to describe the spectrum, the other one being unconstrained by the fit. At first we left the hydrogen column density free to vary; however, we found that in general it was poorly constrained but consistent with the value NH = 7.4 × 1020 cm-2 for all sources, including the two new candidates. We therefore repeated the fits keeping NH fixed to this value, and the resulting best-fit parameters are given in Table 4.
In the case of the classical T Tauri star LOX 100, the fit with fixed NH is not good at low energies, although acceptable ( ). However, we were not able to find a reasonable fit by letting also the column density vary: in fact, we obtained a high value of NH (7 × 1021 cm-2), a very low abundance (0.02 solar), and an extremely high emission measure of the cooler component (EM1 = 5 × 1056 cm-3), which is implausible. Fixing the abundance to Z = 0.1 Z⊙, we obtained
  cm-2, without any significant improvement in the fit quality.
All the sources in our sample, including the two new candidates, have similar coronal properties. We find plasma temperatures of T1 ~ 0.3 − 0.9 keV (3 − 10 MK) and T2 ~ 0.8−2.7 keV (9−30 MK), emission measure ratio EM2/EM1 ~ 0.3−3.6, and subsolar abundances (Z ~ 0.1 − 0.3 Z⊙), in agreement with those obtained for the σ Ori cluster (FPS06; López-Santiago & Caballero 2008) and for other young clusters and SFRs (e.g. Feigelson & Montmerle 1999; Getman et al. 2005; Güdel et al. 2007). The average plasma temperature, weighted with the emission measure, varies between 0.7 and 1.4 keV (8 − 16 MK).
The plasma parameters derived for the B9 star LOX 46 (HD 245140) are consistent with those of the other late-type sources. As shown in Fig. 4, this star underwent a flare at the end of the observation. Late-B stars are not expected to have either strong winds or magnetically active coronae, and their X-ray emission is generally attributed to late-type companions. The presence of flaring activity and the similarity of the X-ray properties of LOX 46 to those of later-type stars support the hypothesis that the observed emission comes from an unknown companion rather than from the B9 star itself.
4.3. HD 245059
HD 245059 (LOX 14, spectral type G8 − K3) is the brightest source in our observation, located at the northwestern edge of the EPIC field of view (see Fig. 1). This star, first detected in X-rays with Einstein (Stone & Taam 1985), has been classified as a weak-lined T Tauri star, due to its strong Li i absorption and weak Hα emission (Fernandez et al. 1995; Alcalá et al. 1996, 2000; Li & Hu 1998). However, as mentioned in Sect. 2.4, HD 245059 is located significantly above the cluster sequence and has a radial velocity of 19.8 ± 1.0 km s-1 (Alcalá et al. 2000), inconsistent with that of the λ Ori cluster (27.0 ± 0.5 km s-1, Sacco et al. 2008; Maxted et al. 2008). Its proper motion (μαcosδ = 11.5 ± 1.5 mas yr-1, μδ = −35.3 ± 1.0 mas yr-1; Dias et al. 2001) is also significantly higher than that of the cluster (0.5 ± 2.8 and − 2.5 ± 2.8 mas yr-1, Dias et al. 2001). Recent Keck and Chandra observations have resolved it into a visual binary (Baldovin-Saavedra et al. 2009), although there is no evidence of radial velocity variations (Fekel 1997; Alcalá et al. 2000). The radial velocity and proper motion of HD 245059 appear to be consistent with those of the recently identified 32 Ori moving group (vr = 18 km s-1, μαcosδ = 8 mas yr-1, μδ = −33 mas yr-1; Mamajek 2007). This group, located at a distance of ~ 90 pc, consists of a number of late-type stars detected in the ROSAT All Sky Survey (e.g. Alcalá et al. 2000) and comoving with the massive binary 32 Ori; the estimated age is ~ 25 Myr.
The light curve of HD 245059 shows a steady increase by a factor of 1.5 during the entire observation, with a small flare at the end. We fitted the spectra using a three-temperature model with variable individual abundances, and the best-fit parameters are listed in Table 3. The plasma temperatures are 0.4, 0.8, and 1.9 keV (~5, 9, and 20 MK) with comparable emission measures, and abundances are strongly subsolar (0.2 − 0.4), with the exception of Ne which is higher (0.7). We find a column density NH ~ 2 × 1020 cm-2, a factor of ~ 4 lower than the cluster mean value. Our results are consistent, within the errors, with those obtained with Chandra for the combined spectrum of the two binary components 2 (Baldovin-Saavedra et al. 2009, Table 3). If the star were at the distance of the λ Ori cluster, it would have a combined X-ray luminosity of 8 × 1031 erg s-1: if we assume the same flux ratio between the two components found by Chandra, the brightest one would still have LX ~ 6 × 1031 erg s-1, which is nearly one order of magnitude higher than cluster members with similar colours. On the other hand, if HD 245059 belongs to the 32 Ori group at 90 pc, its combined X-ray luminosity would decrease to ~ 4 × 1030 erg s-1. According to the Siess et al. (2000) models and assuming negligible reddening, as indicated by the low NH derived by us and by Baldovin-Saavedra et al. (2009), if located at 90 pc this star would have a mass of ~ 1.2 M⊙ and an age of ~ 15 Myr, in agreement with the estimated age of ~ 25 Myr for the 32 Ori group (Mamajek 2007). The derived X-ray luminosity is also consistent with the values found for solar-type stars in λ Ori. These results support the hypothesis that HD 245059 is a foreground young star belonging to the 32 Ori group.
5. X-ray luminosity of cluster members
For the brightest sources for which spectral analysis is available, X-ray fluxes in the 0.3 − 8.0 keV band were derived directly from the best-fit models (see Tables 3 and 4). For the other cluster members and candidates, we used the results of the best-fit models in Table 4 to derive a count rate to flux conversion factor. To this aim, we computed the ratio between the unabsorbed X-ray fluxes derived from the spectral fits and the count rates obtained from the wavelet algorithm on the summed dataset, and then took the median value. The derived conversion factor is CF = 8.7 × 10⁻¹² erg cm-2 cnt-1, with an uncertainty of ~ 15% (1σ standard deviation). X-ray luminosities were then computed using the cluster distance of 400 pc.
Applying this conversion factor to the 3 σ upper limits for undetected members, we obtain a limiting sensitivity LX ~ 3 × 1028 erg s-1 in the centre of the field, decreasing to ~ 6 × 1028 erg s-1 at 12′ offaxis, and to ~ 1 × 1029 erg s-1 in the outer regions covered only by the MOS cameras.
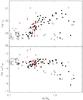 |
Fig. 7 LX (top) and LX/Lbol (bottom) as a function of mass for detected (dots) and undetected (open triangles) cluster members and candidates. We also plot with open diamonds the new candidates with optical photometry. |
In Fig. 7 we show log LX and log LX/Lbol as a function of mass for all cluster members and candidates, including the new candidates with optical photometry. The figure does not include the central O star λ Ori AB (M ~ 27 M⊙), which has a luminosity of ~ 1032 erg s-1 and log LX/Lbol ~ − 6.7, consistent with the typical value found for hot stars (log LX/Lbol ~ − 7; Pallavicini et al. 1981; Berghöfer et al. 1997; Sana et al. 2006). We find that LX increases with stellar mass up to M ~ 2 M⊙, and then drops at higher masses, as commonly observed in SFRs and young open clusters. Below ~ 0.3 M⊙, the X-ray emission of cluster members drops below the sensitivity limit of our observation, resulting in the lack of detections at lower masses. We fitted the relationship below 2 M⊙ using the EM algorithm as implemented in asurv Rev. 1.2 (Lavalley et al. 1992), finding log LX = (1.86 ± 0.30)log M/M⊙ + (29.72 ± 0.14), with a standard deviation of 0.84. The derived slope is in good agreement with those derived for Taurus-Auriga (1.69 ± 0.11, Telleschi et al. 2007) and IC 348 (1.97 ± 0.24, Preibisch & Zinnecker 2002), while it is higher, although consistent within the errors, than the one found for the Orion Nebula Cluster (1.44 ± 0.10, Preibisch et al. 2005). On the other hand, LX/Lbol is nearly constant up to ~ 1 M⊙, and then decreases at higher masses. The median value for M ≤ 1 M⊙ is log LX/Lbol ~ − 3.3 for detections, and ~ − 3.6 taking upper limits into account, similar to what is found for the σ Ori cluster (FPS06) and for other young clusters and SFRs of comparable age (e.g. Flaccomio et al. 2003; Preibisch et al. 2005; Telleschi et al. 2007). As shown in Fig. 7, the new candidates fit into these trends very well. Only one star, DM 24 = LOX 62 (M ~ 1.4 M⊙), deviates significantly from the trend, with LX ~ 1029 erg s-1 and log LX/Lbol ~ − 5, one order of magnitude lower than the other members of similar mass. This star has strong Li i absorption and variable radial velocity (Dolan & Mathieu 1999; D’Orazi et al. 2009), suggesting it is a spectroscopic binary. Therefore, its membership in the cluster is not fully confirmed.
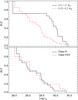 |
Fig. 8 Top panel: comparison between the XLFs for λ Ori members and candidates with masses in the ranges 0.5 − 1 M⊙ (black solid line), and 0.25 − 0.5 M⊙ (red dash-dotted line). Bottom panel: comparison between the XLFs of cluster members and candidates in the mass range M = 0.25 − 0.5 M⊙, classified by Barrado y Navascués et al. (2007) as Class III (black solid line) and Class II or EV objects (red dot-dashed line). |
There are 12 stars with masses between 0.4 and 2 M⊙ that are not detected, with upper limits of ~ 3 − 8 × 1028 erg s-1, significantly lower than detected members in this mass range. Only one of them, LOri 030 (M ~ 0.4 M⊙), identified by Barrado y Navascués et al. (2007) as a Class III source, was observed spectroscopically by Sacco et al. (2008), who classified it as a possible SB2 cluster member. All the other non-detections are photometric candidates from Murdin & Penston (1977) and from Barrado y Navascués et al. (2004, 2007); the latter were all classified as Class III sources. Since PMS stars are known to be strong X-ray emitters, with luminosities 10 − 104 times higher than older late-type stars (Feigelson & Montmerle 1999), the lack of strong X-ray emission and of any evidence of circumstellar material suggests that these objects might be older field stars unrelated to the λ Ori region, rather than true cluster members.
Figure 8 (top panel) shows the X-ray luminosity functions (XLFs) for stars in the two mass bins 0.5 − 1 M⊙ and 0.25 − 0.5 M⊙, computed using asurv. The difference in X-ray luminosity between the two samples is clearly evident. We find a median log LX = 29.9 erg s-1 for stars between 0.5 and 1 M⊙, and log LX = 29.3 erg s-1 for stars between 0.25 and 0.5 M⊙, i.e. lower by a factor of ~ 4.
In the bottom panel of Fig. 8 we compare the XLF of the sample of Class II and EV sources with that of Class III sources, for stars with M = 0.25 − 0.5 M⊙. Higher–mass stars with Spitzer classification are all Class III objects, therefore we exclude them from the comparison to avoid biases due to their higher luminosities. The two distributions are indistinguishable, with a median luminosity of log LX = 29.0 erg s-1 for both classes, in agreement with the results obtained for other young clusters and SFRs (e.g. Preibisch & Zinnecker 2001; Getman et al. 2002; Feigelson et al. 2003; Preibisch et al. 2005). However, the sample of stars with discs is very small, containing only 12 objects, therefore this result might be affected by statistical biases and cannot be considered conclusive. Hα observations are available for 11 Class II or EV stars, showing evidence for accretion in six of them (Dolan & Mathieu 1999; Sacco et al. 2008). Given the small size of the sample of accreting objects, the comparison of their XLF with that of non-accreting stars is not useful. Accreting stars were all detected except for one (located too close to a bright source), with luminosities of 1 × 1029 − 2 × 1030 erg s-1, comparable to those of non-accreting members.
6. Comparison with the σ Ori cluster
In this section we compare our results with those obtained for the σ Ori cluster. This cluster is very similar to λ Ori, with a few hundred PMS stars concentrated around a central O star and a comparable age of ~ 2 − 5 Myr. However, as mentioned in Sect. 1, the two clusters differ for the higher fraction of stars with discs and stars with active accretion observed in σ Ori (Sacco et al. 2008, and references therein) and for the supernova explosion that affected the λ Ori region.
The σ Ori cluster was observed by XMM-Newton by FPS06 at a similar sensitivity, and the data were analysed consistently with our present analysis, so that the results of the two observations can be directly compared. Another XMM-Newton observation to the west of the cluster centre has been performed by López-Santiago & Caballero (2008); however, to avoid possible biases, we did not include their data in our comparison, since their observation was performed with a different filter, implying a different sensitivity limit, and it was analysed using a different method. After the FPS06 paper was published, several new studies of the σ Ori cluster have become available, which have significantly improved the membership information for many stars. Before performing the comparison, we have therefore updated the catalogue of FPS06, using mainly information from the Mayrit catalogue by Caballero (2008b), the spectroscopic studies by Sacco et al. (2008) and Maxted et al. (2008), the Spitzer study by Hernández et al. (2007), the proper motion study by Caballero (2010), and updated photometry from Kenyon et al. (2005) and Mayne & Naylor (2008). We rejected ~ 20% (40/210) of the late-type stars considered as members by FPS06, most of which were not detected in X-rays, and added 25 new members and candidates with M ~ 0.1 − 2 M⊙, nine of which were detected by FPS06; for the others, upper limits were computed as described in FPS06 and in Sect. 2.4. Masses for σ Ori members were computed in the same way as for λ Ori (see Sect. 2.3). For consistency with FPS06 and other studies of the σ Ori cluster, we adopt the Hipparcos distance of 352 pc, although recent determinations give values between ~ 385 pc and 420 pc (Caballero 2008a; Mayne & Naylor 2008; Sherry et al. 2008). Using an average value of 400 pc would only increase the X-ray luminosities of σ Ori stars by ~ 0.1 dex, without significantly affecting the distribution of stars in the mass bins considered in our analysis.
Figure 9 shows LX and LX/Lbol as a function of mass for detected members of the λ Ori and σ Ori clusters. There are no significant differences in the trends observed for the two clusters, except for a wider spread in the X-ray luminosities observed in σ Ori, which is particularly evident for masses between ~ 0.5 and ~ 1 M⊙: while the luminosities of λ Ori stars differ by less than 1 dex, the spread for the σ Ori cluster is ~ 2 dex. In particular, there are several σ Ori members with log LX > 30.6 erg s-1, i.e. brighter than λ Ori stars of similar mass. Most of these objects are very active, displaying strong flares or significant variability, and hotter plasma than observed in λ Ori, with average temperature above 2 keV. Such high-activity stars are not observed in λ Ori. However, since the number of stars in the λ Ori sample is much lower than in the σ Ori one, it is possible that the lack of stars at high-activity levels might be due to a statistical bias due to the smallness of the sample, rather than indicating a difference in magnetic activity between the two clusters.
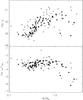 |
Fig. 9 Comparison of LX (top) and LX/Lbol (bottom) vs. mass for detected members and candidates of the λ Ori (filled circles) and σ Ori (open diamonds) clusters. |
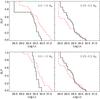 |
Fig. 10 Upper panels: comparison between the XLFs of the λ Ori (black solid line) and σ Ori (red dash-dotted line) clusters for members and candidates with masses 0.5 − 1 M⊙ (left) and 0.25 − 0.5 M⊙ (right). Lower panels: same comparison only for spectroscopically-confirmed members. |
Comparison between the luminosity distributions of the λ Ori and σ Ori clusters.
In Fig. 10 we compare the XLFs of λ Ori and σ Ori stars in the 0.5−1 M⊙ and 0.25−0.5 M⊙ mass bins, and the medians of the distributions are given in Table 5. In the upper panels, we show the comparison for the whole sample of cluster members and candidates. As already suggested by Fig. 9, stars with M = 0.5−1 M⊙ in λ Ori are less luminous in X-rays than those of σ Ori, with median X-ray luminosities differing by a factor of 2. The two-sample tests in asurv confirm that the two distributions differ at the 90% level. On the other hand, stars with M = 0.25−0.5 M⊙ appear to be more luminous in λ Ori, although the high-luminosity tails of the two XLFs are comparable.
The difference between the XLFs of stars with M = 0.5−1 M⊙ can be explained, at least in part, with contamination of the samples by non-members. As mentioned in Sect. 5, all the non-detections among λ Ori stars in this mass range are only photometric candidates, which are likely to be older field stars, rather than true cluster members. Including these contaminants as candidates results in a lower median luminosity of the λ Ori sample. On the other hand, as shown in Fig. 9, in the σ Ori sample there are some high-luminosity active stars that are not observed in λ Ori. Half of these bright stars are young objects with unknown radial velocity, and it is possible that some of them might belong to one of the foreground young populations that are present in the region (e.g. Alcalá et al. 2000; Jeffries et al. 2006). To exclude the effects of contamination by non-members, in the bottom panel of Fig. 10 we compare the XLFs computed considering only spectroscopically-confirmed members, i.e. stars having both signatures of youth and radial velocity consistent with that of the clusters. In the 0.5 − 1 M⊙ mass bin, all confirmed members in λ Ori and 95% of those in σ Ori are detected, and the discrepancy between the two XLFs is reduced, although the medians still differ by 0.2 dex. Similar results are obtained for the lower mass bin. In both cases, the results of the two-sample tests do not allow us to reject the hypothesis that the two distributions are derived from the same parent population. As a result, the differences observed in the upper panels of Fig. 10 are not real, but can be attributed to the uncertainties in the membership information of the two clusters. The residual differences in the XLFs of confirmed members are comparable to the expected uncertainties in the derived X-ray luminosities due to the uncertainties in the distance of σ Ori and in the derived conversion factors. Therefore, we conclude that there is no convincing evidence for any significant difference in the X-ray properties of the two clusters.
7. Summary and conclusions
In this paper we have presented the analysis of an XMM-Newton observation of the λ Ori cluster, centred on the O8 III star λ Ori AB. We derived the X-ray properties of cluster members and analysed the EPIC spectra of the central hot star and of the brightest sources in the field. Our results can be summarised as follows.
-
We detected 58 cluster members and candidates above a limitingsensitivity of ~3 × 1028 erg s-1, spanning the cluster sequence from the central O8III star λ Ori AB down to stars with M ~ 0.2 M⊙, and identified 24 new possible cluster candidates from the 2MASS catalogue. We did not detect any X-ray emission from 11 Class III candidate members with masses between 0.4 and 2 M⊙, suggesting that these objects might be older field stars rather than cluster members.
-
We found significant variability in ~35% of detected members and candidates, including strong flares in ~10% of them, in agreement with other observations of SFRs and very young clusters.
-
The emission from the central O III star is soft, with the bulk of the plasma at temperatures of 0.2 − 0.3 keV, and an X-ray luminosity of ~1032 erg s-1, in agreement with other observations of massive stars, and consistently with a wind origin. We did not find the hot component at ~25 MK derived from ASCA, which can be attributed to contamination by the sources surrounding λ Ori AB and included in the large ASCA extraction region. On the other hand, late-type stars show harder spectra, with coronal temperatures of 0.3 − 0.9 keV and 0.8 − 2.7 keV and strongly subsolar abundances, as commonly observed in PMS late-type stars.
-
The high X-ray luminosity derived from spectral analysis of the weak-lined T Tauri star HD 245059 confirms that it does not belong to the λ Ori cluster, but it is likely a foreground PMS star.
-
We found that LX increases with stellar mass up to 2 M⊙, with a slope of ~1.9, in agreement with the results obtained for other SFRs and young clusters, while log LX/Lbol is nearly constant around a median value of − 3.5. No significant difference is found in the X-ray luminosity of stars with or without circumstellar discs.
-
Finally, we compared the X-ray properties of λ Ori late-type stars with those of the coeval σ Ori cluster. The properties of the two clusters appear to be very similar, suggesting that stellar activity in the λ Ori cluster has not been significantly affected by the different ambient environment.
Online material
Appendix A: X-ray detections and upper limits
X-ray sources detected in the λ Ori cluster.
3σ upper limits and optical properties of undetected cluster members and candidates.
Available at http://vizier.u-strasbg.fr/
Baldovin-Saavedra et al. (2009) find NH = 7.7 × 1019 cm-2, lower than ours by a factor of 2.5 but consistent within the errors. The differences in the derived NH might be a consequence of the differences in the fitted abundances, since these parameters are not independent.
Acknowledgments
We thank J. A. Caballero for his useful comments as referee of this paper. We acknowledge partial financial support from Ministero dell’Istruzione, Università e Ricerca (MIUR). Research on X-rays from young stars by G.S. is supported by NASA/Goddard XMM-Newton Guest Observer Facility grants NNX09AT15G and NNX09AC11G and NASA Astrophysics Data Analysis programme grant NNX09AC96G to RIT. This publication makes use of data products from the Two Micron All Sky Survey, which is a joint project of the University of Massachusetts and the Infrared Processing and Analysis Center/California Institute of Technology, and of the Guide Star Catalogue-II, which is a joint project of the Space Telescope Science Institute and the Osservatorio Astronomico di Torino. This research has made use of the Simbad and VizieR databases available at the CDS.
References
- Alcalá, J. M., Terranegra, L., Wichmann, R., et al. 1996, A&AS, 119, 7 [NASA ADS] [CrossRef] [EDP Sciences] [Google Scholar]
- Alcalá, J. M., Covino, E., Torres, G., et al. 2000, A&A, 353, 186 [NASA ADS] [Google Scholar]
- Alexander, D. M., Bauer, F. E., Brandt, W. N., et al. 2003, AJ, 126, 539 [NASA ADS] [CrossRef] [Google Scholar]
- Anders, E., & Grevesse, N. 1989, Geochim. Cosmochim. Acta, 53, 197 [Google Scholar]
- Baldovin-Saavedra, C., Audard, M., Duchêne, G., et al. 2009, ApJ, 697, 493 [NASA ADS] [CrossRef] [Google Scholar]
- Baraffe, I., Chabrier, G., Allard, F., & Hauschildt, P. H. 1998, A&A, 337, 403 [NASA ADS] [Google Scholar]
- Barrado y Navascués, D., Stauffer, J. R., Bouvier, J., Jayawardhana, R., & Cuillandre, J.-C. 2004, ApJ, 610, 1064 [NASA ADS] [CrossRef] [Google Scholar]
- Barrado y Navascués, D., Stauffer, J. R., Morales-Calderón, M., et al. 2007, ApJ, 664, 481 [NASA ADS] [CrossRef] [Google Scholar]
- Barrado, D., Stelzer, B., Morales-Calderón, M., et al. 2011, A&A, 526, A21 [NASA ADS] [CrossRef] [EDP Sciences] [Google Scholar]
- Berghöfer, T. W., Schmitt, J. H. M. M., Danner, R., & Cassinelli, J. P. 1997, A&A, 322, 167 [NASA ADS] [Google Scholar]
- Bouy, H., Huélamo, N., Barrado y Navascués, D., et al. 2009, A&A, 504, 199 [NASA ADS] [CrossRef] [EDP Sciences] [Google Scholar]
- Caballero, J. A. 2008a, MNRAS, 383, 750 [Google Scholar]
- Caballero, J. A. 2008b, A&A, 478, 667 [NASA ADS] [CrossRef] [EDP Sciences] [Google Scholar]
- Caballero, J. A. 2010, A&A, 514, A18 [NASA ADS] [CrossRef] [EDP Sciences] [Google Scholar]
- Caballero, J. A., Albacete-Colombo, J. F., & López-Santiago, J. 2010, A&A, 521, A45 [NASA ADS] [CrossRef] [EDP Sciences] [Google Scholar]
- Cohen, D. H., Kuhn, M. A., Gagné, M., Jensen, E. L. N., & Miller, N. A. 2008, MNRAS, 386, 1855 [NASA ADS] [CrossRef] [Google Scholar]
- Corcoran, M. F., Waldron, W. L., MacFarlane, J. J., et al. 1994, ApJ, 436, L95 [NASA ADS] [CrossRef] [Google Scholar]
- Damiani, F., Maggio, A., Micela, G., & Sciortino, S. 1997, ApJ, 483, 350 [NASA ADS] [CrossRef] [Google Scholar]
- Day, G. A., Shimmins, A. J., Ekers, R. D., & Cole, D. J. 1966, Austr. J. Phys., 35 [Google Scholar]
- Dias, W. S., Lépine, J. R. D., & Alessi, B. S. 2001, A&A, 376, 441 [NASA ADS] [CrossRef] [EDP Sciences] [Google Scholar]
- Diplas, A., & Savage, B. D. 1994, ApJS, 93, 211 [NASA ADS] [CrossRef] [Google Scholar]
- Dolan, C. J., & Mathieu, R. D. 1999, AJ, 118, 2409 [NASA ADS] [CrossRef] [Google Scholar]
- Dolan, C. J., & Mathieu, R. D. 2001, AJ, 121, 2124 [NASA ADS] [CrossRef] [Google Scholar]
- Dolan, C. J., & Mathieu, R. D. 2002, AJ, 123, 387 [NASA ADS] [CrossRef] [Google Scholar]
- D’Orazi, V., Randich, S., Flaccomio, E., et al. 2009, A&A, 501, 973 [NASA ADS] [CrossRef] [EDP Sciences] [Google Scholar]
- Favata, F., Flaccomio, E., Reale, F., et al. 2005, ApJS, 160, 469 [NASA ADS] [CrossRef] [Google Scholar]
- Feigelson, E. D., & Montmerle, T. 1999, ARA&A, 37, 363 [NASA ADS] [CrossRef] [Google Scholar]
- Feigelson, E. D., Gaffney, III, J. A., Garmire, G., Hillenbrand, L. A., & Townsley, L. 2003, ApJ, 584, 911 [NASA ADS] [CrossRef] [Google Scholar]
- Fekel, F. C. 1997, PASP, 109, 514 [NASA ADS] [CrossRef] [Google Scholar]
- Fernandez, M., Ortiz, E., Eiroa, C., & Miranda, L. F. 1995, A&AS, 114, 439 [NASA ADS] [Google Scholar]
- Flaccomio, E., Micela, G., & Sciortino, S. 2003, A&A, 402, 277 [NASA ADS] [CrossRef] [EDP Sciences] [Google Scholar]
- Franciosini, E., Pallavicini, R., & Sanz-Forcada, J. 2006, A&A, 446, 501, (FPS06) [NASA ADS] [CrossRef] [EDP Sciences] [Google Scholar]
- Franciosini, E., Pillitteri, I., Stelzer, B., et al. 2007, A&A, 468, 485 [NASA ADS] [CrossRef] [EDP Sciences] [Google Scholar]
- Getman, K. V., Feigelson, E. D., Townsley, L., et al. 2002, ApJ, 575, 354 [NASA ADS] [CrossRef] [Google Scholar]
- Getman, K. V., Flaccomio, E., Broos, P. S., et al. 2005, ApJS, 160, 319 [NASA ADS] [CrossRef] [Google Scholar]
- Getman, K. V., Feigelson, E. D., Broos, P. S., Micela, G., & Garmire, G. P. 2008, ApJ, 688, 418 [NASA ADS] [CrossRef] [Google Scholar]
- Güdel, M., Briggs, K. R., Arzner, K., et al. 2007, A&A, 468, 353 [NASA ADS] [CrossRef] [EDP Sciences] [Google Scholar]
- Hernández, J., Hartmann, L., Megeath, T., et al. 2007, ApJ, 662, 1067 [NASA ADS] [CrossRef] [Google Scholar]
- Hernández, J., Calvet, N., Hartmann, L., et al. 2009, ApJ, 707, 705 [NASA ADS] [CrossRef] [Google Scholar]
- Jeffries, R. D., Evans, P. A., Pye, J. P., & Briggs, K. R. 2006, MNRAS, 367, 781 [NASA ADS] [CrossRef] [MathSciNet] [Google Scholar]
- Kenyon, S. J., & Hartmann, L. 1995, ApJS, 101, 117 [NASA ADS] [CrossRef] [Google Scholar]
- Kenyon, M. J., Jeffries, R. D., Naylor, T., Oliveira, J. M., & Maxted, P. F. L. 2005, MNRAS, 356, 89 [NASA ADS] [CrossRef] [Google Scholar]
- Kharchenko, N. V., Piskunov, A. E., Röser, S., Schilbach, E., & Scholz, R.-D. 2004, AN, 325, 740 [NASA ADS] [Google Scholar]
- Lavalley, M., Isobe, T., & Feigelson, E. 1992, in Astronomical Data Analysis Software and Systems, ed. D. M. Worrall et al., ASP Conf. Ser., 25, 245 [Google Scholar]
- Li, J. Z., & Hu, J. Y. 1998, A&AS, 132, 173 [NASA ADS] [CrossRef] [EDP Sciences] [Google Scholar]
- López-Santiago, J., & Caballero, J. A. 2008, A&A, 491, 961 [NASA ADS] [CrossRef] [EDP Sciences] [Google Scholar]
- Maddalena, R. J., & Morris, M. 1987, ApJ, 323, 179 [NASA ADS] [CrossRef] [Google Scholar]
- Magazzu, A., Martin, E. L., Sterzik, M. F., et al. 1997, A&AS, 124, 449 [NASA ADS] [CrossRef] [EDP Sciences] [Google Scholar]
- Mamajek, E. E. 2007, in Triggered Star Formation in a Turbulent ISM, ed. B. G. Elmegreen, & J. Palous, IAU Symp., 237, 442 [Google Scholar]
- Maxted, P. F. L., Jeffries, R. D., Oliveira, J. M., Naylor, T., & Jackson, R. J. 2008, MNRAS, 385, 2210 [NASA ADS] [CrossRef] [Google Scholar]
- Mayne, N. J., & Naylor, T. 2008, MNRAS, 386, 261 [NASA ADS] [CrossRef] [Google Scholar]
- Murdin, P., & Penston, M. V. 1977, MNRAS, 181, 657 [NASA ADS] [CrossRef] [Google Scholar]
- Nazé, Y. 2009, A&A, 506, 1055 [NASA ADS] [CrossRef] [EDP Sciences] [Google Scholar]
- Neuhäuser, R., Sterzik, M. F., Schmitt, J. H. M. M., Wichmann, R., & Krautter, J. 1995, A&A, 297, 391 [NASA ADS] [Google Scholar]
- Neuhäuser, R., Torres, G., Sterzik, M. F., & Randich, S. 1997, A&A, 325, 647 [NASA ADS] [Google Scholar]
- Ozawa, H., Grosso, N., & Montmerle, T. 2005, A&A, 429, 963 [NASA ADS] [CrossRef] [EDP Sciences] [Google Scholar]
- Pallavicini, R., Golub, L., Rosner, R., et al. 1981, ApJ, 248, 279 [NASA ADS] [CrossRef] [Google Scholar]
- Preibisch, T., & Zinnecker, H. 2001, AJ, 122, 866 [NASA ADS] [CrossRef] [Google Scholar]
- Preibisch, T., & Zinnecker, H. 2002, AJ, 123, 1613 [NASA ADS] [CrossRef] [Google Scholar]
- Preibisch, T., Kim, Y.-C., Favata, F., et al. 2005, ApJS, 160, 401 [NASA ADS] [CrossRef] [Google Scholar]
- Randich, S., & Schmitt, J. H. M. M. 1995, A&A, 298, 115 [NASA ADS] [Google Scholar]
- Sacco, G. G., Franciosini, E., Randich, S., & Pallavicini, R. 2008, A&A, 488, 167 [NASA ADS] [CrossRef] [EDP Sciences] [Google Scholar]
- Sana, H., Rauw, G., Nazé, Y., Gosset, E., & Vreux, J.-M. 2006, MNRAS, 372, 661 [NASA ADS] [CrossRef] [Google Scholar]
- Sanz-Forcada, J., Franciosini, E., & Pallavicini, R. 2004, A&A, 421, 715 [NASA ADS] [CrossRef] [EDP Sciences] [Google Scholar]
- Sherry, W. H., Walter, F. M., Wolk, S. J., & Adams, N. R. 2008, AJ, 135, 1616 [NASA ADS] [CrossRef] [Google Scholar]
- Siess, L., Dufour, E., & Forestini, M. 2000, A&A, 358, 593 [NASA ADS] [Google Scholar]
- Skinner, S., Gagné, M., & Belzer, E. 2003, ApJ, 598, 375 [NASA ADS] [CrossRef] [Google Scholar]
- Skinner, S. L., Sokal, K. R., Cohen, D. H., et al. 2008, ApJ, 683, 796 [NASA ADS] [CrossRef] [Google Scholar]
- Skrutskie, M. F., Cutri, R. M., Stiening, R., et al. 2006, AJ, 131, 1163 [NASA ADS] [CrossRef] [Google Scholar]
- Stelzer, B., Neuhäuser, R., Casanova, S., & Montmerle, T. 1999, A&A, 344, 154 [NASA ADS] [Google Scholar]
- Sterzik, M. F., Alcala, J. M., Neuhäuser, R., & Schmitt, J. H. M. M. 1995, A&A, 297, 418 [NASA ADS] [Google Scholar]
- Stone, R. C., & Taam, R. E. 1985, ApJ, 291, 183 [NASA ADS] [CrossRef] [Google Scholar]
- Telleschi, A., Güdel, M., Briggs, K. R., Audard, M., & Palla, F. 2007, A&A, 468, 425 [Google Scholar]
- Tozzi, P., Rosati, P., Nonino, M., et al. 2001, ApJ, 562, 42 [NASA ADS] [CrossRef] [Google Scholar]
- Vuong, M. H., Montmerle, T., Grosso, N., et al. 2003, A&A, 408, 581 [NASA ADS] [CrossRef] [EDP Sciences] [Google Scholar]
- Williams, P. J. S., Collins, R. A., Caswell, J. L., & Holden, D. J. 1968, MNRAS, 139, 289 [NASA ADS] [Google Scholar]
- Zhang, C. Y., Laureijs, R. J., Chlewicki, G., Clark, F. O., & Wesselius, P. R. 1989, A&A, 218, 231 [NASA ADS] [Google Scholar]
- Zhekov, S. A., & Palla, F. 2007, MNRAS, 382, 1124 [NASA ADS] [CrossRef] [Google Scholar]
All Tables
X-ray and optical properties of sources identified with known cluster members and candidates.
Result of the joint PN and MOS spectral fitting for the hot star λ Ori AB and for the non-member weak-lined T Tauri star HD 245059.
Best-fit parameters from the joint PN and MOS spectral fits for bright cluster members and two new candidates.
Comparison between the luminosity distributions of the λ Ori and σ Ori clusters.
3σ upper limits and optical properties of undetected cluster members and candidates.
All Figures
|
Fig. 1 Composite EPIC MOS1+MOS2+PN image of the λ Ori field in the 0.3 − 7.8 keV energy band. |
| In the text | |
|
Fig. 2 I vs. (R − I) colour–magnitude diagram (top panel), J vs. (J − Ks) colour–magnitude diagram (middle panel), and (J − Ks) vs. (I − J) colour–colour diagram (bottom panel) for objects in the XMM-Newton field of view. Filled and open circles indicate detected and undetected members and candidates, respectively, while red diamonds indicate the possible new candidates detected in our observation. Detected non-members are marked as blue crosses; the boxed cross symbol indicates HD 245059, discussed in Sect. 4.3. The solid and dashed lines are 1, 5, 10, and 20 Myr isochrones from Siess et al. (2000) and Baraffe et al. (1998). The star with strong (J − Ks) excess is the HAeBe star HD 245185. |
| In the text | |
|
Fig. 3 Hardness ratios HR2 vs. HR1 for all detected sources. We indicate with different symbols cluster members and candidates (filled circles), new candidates (red diamonds), previously known non-members (blue crosses), other sources with counterparts in 2MASS (open squares) or in other catalogues (triangles) and sources without counterparts (pluses). |
| In the text | |
|
Fig. 4 Combined PN+MOS1+MOS2 light curves of cluster members and candidates showing strong flares during our observation. Count rates are expressed as MOS equivalent count rates. The different bin size used for each source is indicated at the top of each panel together with the source identification. |
| In the text | |
|
Fig. 5 Same as Fig. 4 but for the brightest cluster members and candidates showing gradual variations or variability not clearly attributable to flares. |
| In the text | |
|
Fig. 6 PN (black) and MOS (red and blue) spectra of λ Ori AB, together with the best-fit model. |
| In the text | |
|
Fig. 7 LX (top) and LX/Lbol (bottom) as a function of mass for detected (dots) and undetected (open triangles) cluster members and candidates. We also plot with open diamonds the new candidates with optical photometry. |
| In the text | |
|
Fig. 8 Top panel: comparison between the XLFs for λ Ori members and candidates with masses in the ranges 0.5 − 1 M⊙ (black solid line), and 0.25 − 0.5 M⊙ (red dash-dotted line). Bottom panel: comparison between the XLFs of cluster members and candidates in the mass range M = 0.25 − 0.5 M⊙, classified by Barrado y Navascués et al. (2007) as Class III (black solid line) and Class II or EV objects (red dot-dashed line). |
| In the text | |
|
Fig. 9 Comparison of LX (top) and LX/Lbol (bottom) vs. mass for detected members and candidates of the λ Ori (filled circles) and σ Ori (open diamonds) clusters. |
| In the text | |
|
Fig. 10 Upper panels: comparison between the XLFs of the λ Ori (black solid line) and σ Ori (red dash-dotted line) clusters for members and candidates with masses 0.5 − 1 M⊙ (left) and 0.25 − 0.5 M⊙ (right). Lower panels: same comparison only for spectroscopically-confirmed members. |
| In the text | |
Current usage metrics show cumulative count of Article Views (full-text article views including HTML views, PDF and ePub downloads, according to the available data) and Abstracts Views on Vision4Press platform.
Data correspond to usage on the plateform after 2015. The current usage metrics is available 48-96 hours after online publication and is updated daily on week days.
Initial download of the metrics may take a while.