Free Access
Fig. 4
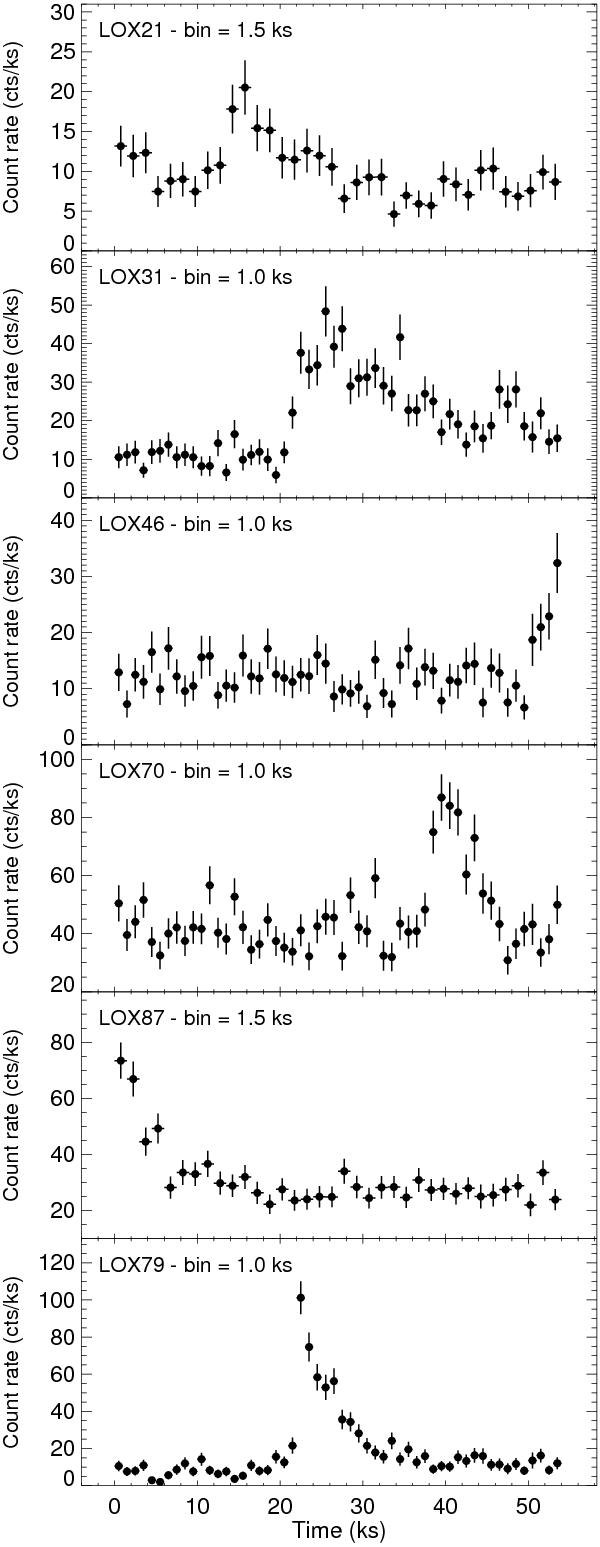
Combined PN+MOS1+MOS2 light curves of cluster members and candidates showing strong flares during our observation. Count rates are expressed as MOS equivalent count rates. The different bin size used for each source is indicated at the top of each panel together with the source identification.
Current usage metrics show cumulative count of Article Views (full-text article views including HTML views, PDF and ePub downloads, according to the available data) and Abstracts Views on Vision4Press platform.
Data correspond to usage on the plateform after 2015. The current usage metrics is available 48-96 hours after online publication and is updated daily on week days.
Initial download of the metrics may take a while.