Fig. 2
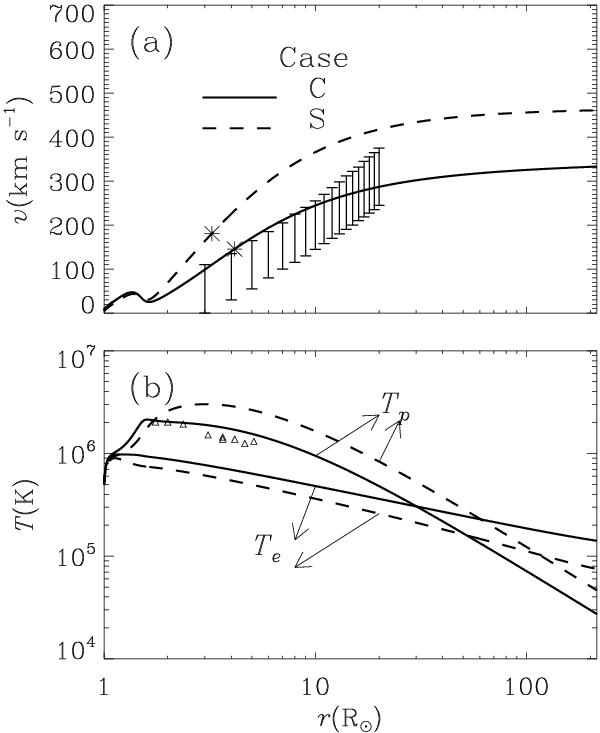
Alfvén wave-turbulence-based solar wind models incorporating effects of field line shape. Radial profiles are shown for a) the solar wind speed v, and b) the electron and proton temperatures Te and Tp. The curved (straight) case in which the field line shape is considered (neglected) is given by the solid (dashed) lines. In a), the asterisks indicate the sonic point where v equals the effective sonic speed cS defined by Eq. (6), while the vertical bars represent wind speeds measured by tracking small density inhomogeneities (blobs) in SOHO/LASCO images as given by Wang et al. (2000). The triangles in b) give the hydrogen kinetic temperatures derived from H I Lyα measurements with SOHO/UVCS for a typical solar minimum streamer (Strachan et al. 2002).
Current usage metrics show cumulative count of Article Views (full-text article views including HTML views, PDF and ePub downloads, according to the available data) and Abstracts Views on Vision4Press platform.
Data correspond to usage on the plateform after 2015. The current usage metrics is available 48-96 hours after online publication and is updated daily on week days.
Initial download of the metrics may take a while.