| Issue |
A&A
Volume 529, May 2011
|
|
|---|---|---|
| Article Number | A56 | |
| Number of page(s) | 6 | |
| Section | Stellar structure and evolution | |
| DOI | https://doi.org/10.1051/0004-6361/201016406 | |
| Published online | 31 March 2011 | |
Research Note
The new carbon symbiotic star IPHAS J205836.43+503307.2⋆
1
Instituto de Astrofísica de Canarias, 38200 La Laguna, Tenerife, Spain
e-mail: This email address is being protected from spambots. You need JavaScript enabled to view it.
2
Departamento de Astrofísica, Universidad de La Laguna, 38206 La Laguna, Tenerife, Spain
3
Instituto de Astronomía, Universidad Nacional Autónoma de México, Apdo. Postal 877, 22800 Ensenada, B.C, Mexico
4 INAF - Osservatorio Astronomico di Padova, via dell’Osservatorio 8, 36012 Asiago (VI), Italy
5 ANS Collaboration, c/o Osservatorio Astronomico, 36012 Asiago (VI), Italy
6
Departamento de Astronomía y Astrofísica, Pontificia Universidad Catolica de Chile, Santiago, Chile
7
Institut für Physik, Karl-Franzen Universität Graz, Universitätsplatz 5, 8010 Graz, Austria
Received: 24 December 2010
Accepted: 4 March 2011
Abstract
Aims. We are performing a search for symbiotic stars using IPHAS, the INT Hα survey of the northern Galactic plane, and follow-up observations.
Methods. Candidate symbiotic stars are selected on the basis of their IPHAS and near-IR colours, and spectroscopy and photometry are obtained to determine their nature. We present here observations of the symbiotic star candidate IPHAS J205836.43+503307.2.
Results. The optical spectrum shows the combination of a number of emission lines, among which are the high-excitation species of [O iii], He ii, [Ca v], and [Fe vii], and a red continuum with the features of a star at the cool end of the carbon star sequence. The nebular component is spatially resolved: the analysis of the spatial profile of the [N ii]6583 line in the spectrum indicates a linear size of ~ 2 along the east-west direction. Its velocity structure suggests an aspherical morphology. The near-infrared excess of the source, which was especially strong in 1999, indicated that a thick circumstellar dust shell was also present in the system. The carbon star has brightened in the last decade by two to four magnitudes at red and near-infrared wavelengths. Photometric monitoring during a period of 60 days from November 2010 to January 2011 reveals a slow luminosity decrease of 0.2 mag.
Conclusions. From the observed spectrophotometric properties and variability, we conclude that the source is a new Galactic symbiotic star of the D-type, of the rare kind that contains a carbon star, likely a carbon Mira. Only two other systems of this type are known in the Galaxy.
Key words: surveys / binaries: symbiotic
Based on observations obtained with the 2.5 m INT and the 4.2 m WHT telescopes of the Isaac Newton Group of Telescopes and the 1.5 m Carlos Sanchez Telescope, operating on the islands of La Palma and Tenerife at the Spanish Observatories of the Roque de Los Muchachos and Teide of the Instituto de Astrofísica de Canarias; the 2.1 m telescope at San Pedro Martir, Mexico; and the GAPC 0.7 m Ritchey-Chrétien telescope at La Polse di Cougnes, Udine, Italy.
© ESO, 2011
1. Introduction
The total population of symbiotic stars in the Galaxy is an important figure for determining the timescales and characteristics of this binary channel of stellar evolution. It also has direct implications on the hypothesis that symbiotic stars are SN Ia progenitors (Munari & Renzini 1992; Di Stefano 2010). Because the known number of symbiotic stars (less than 200, Belczyński et al. 2000) is a tiny fraction of the total number expected (two to three orders of magnitudes larger), we embarked on a systematic search for symbiotic systems in the Galaxy. The search takes advantage of IPHAS, the Hα survey of the northern Galactic plane (Drew et al. 2005), and will be extended to the whole Galactic plane and part of the bulge with its approaching southern counterpart (VPHAS+). So far, thirteen new symbiotic stars have been discovered (Corradi et al. 2008, 2010a,b; Corradi & Giammanco 2010), which more than doubles the number of systems previously known in the area covered by IPHAS. We present here a new detection, IPHAS J205836.43+503307.2 (l = 90 19 b = + 311), and the study of its spectroscopic and photometric properties. The source was previously known to be an Hα-emitting star and was catalogued as HBHA 5202-01 by Kohoutek & Wehmeyer (1999).
2. Observational data
2.1. Spectroscopy
A 30 min spectrum of IPHAS J205836.43+503307.2 was obtained at the 2.5 m Isaac Newton Telescope (INT) on La Palma, Spain, on 1 August 2006 during recommissioning of the IDS spectrograph. The R300V grating was used with a slit width of 1.1 arcsec. This results in a spectral resolution of 4.8 Å with a dispersion of 1.9 Å pix-1 over a spectral range from 4250 to 8300 Å. A more recent spectrum was obtained on 19 September 2010 at the 2.1 m telescope of San Pedro Martir (SPM), Mexico, with the Boller and Chivens spectrograph. The 400 line mm-1 grating was used combined with the OG550 filter to remove second order contamination, and with a  wide slit, providing a dispersion of 1.9 Å pix-1, a resolution of 5.5 Å, and a spectral coverage from 5850 to 9700 Å. Total exposure time was 60 min. Flux calibration was determined by observing spectrophotometric standard stars from Oke (1990) immediately after the target on each night. For the SPM spectrum, the flux calibration is uncertain above 9200 Å. In addition, both spectra suffer from fringing longward of Hα, which in the SPM spectrum was partially corrected by lamp flat fields taken during the night.
An additional spectrum was obtained on 26 December 2010 at the 4.2 m William Herschel Telescope (WHT) on La Palma. In the red arm of the ISIS spectrograph, grating R158R was used combined with a 1′′ wide slit, providing a dispersion of 1.8 Å pix-1, a resolution of 6.5 Å, and a spectral coverage from 5400 to ~10 000 Å. The exposure time was 20 min. This spectrum was obtained on a cloudy night, but under excellent seeing (0 7): for this reason, in the following it will be only used to investigate the spatial profile and velocity structure of emission lines.
A high-resolution spectrum around Hα was obtained with the 2.1 m telescope at SPM using the Mezcal spectrograph on 21 September 2010. The 2′′ wide slit provided a resolution of 0.25 Å with a dispersion of 0.06 Å pix-1. Spectral coverage was from 6531 to 6593 Å, and the exposure time was 90 min.
2.2. Photometry
Two IPHAS photometric measurements, both obtained on 10 November 2003, are available. The IPHAS (SDSS) magnitudes of the source at that time, listed in Table 1, indicated the presence of a red star (r′ − i′ = 2.0) with a strong Hα line in emission (r′ − Hα = 2.2, cf. the colour-colour diagram of Corradi et al. 2008). This drew our attention to the object. Because the global photometric calibration of IPHAS is not available yet, the error on these magnitudes is conservatively taken as 0.1 mag.
Seven years later, from November 2010 to January 2011, we obtained new photometric measurements using the GAPC 0.7 m Ritchey-Chrétien telescope at La Polse di Cougnes, Udine, Italy. It is equipped with an Apogee ALTA U9000 CCD Camera 3056 × 3056 array, with 12 μm pixels ≡ 0.44′′ pix-1 and field of view of 22′ × 22′. The instrumental magnitudes, obtained through R and I Cousins filters, were placed on the photometric system of the IPHAS survey by determining the transformation colour equations using fifteen field stars that span a wide range of IPHAS colours that well encompass those of our programme star. The new photometric points are also listed in Table 1. Quoted errors are the quadratic sum of the Poissonian and colour transformation errors.
IPHAS J205836.43+503307.2 was detected by the near-infrared 2MASS survey in 1999. We obtained new J, H and Ks magnitudes on 24 November 2010 with the 1.5 m Carlos Sanchez Telescope (TCS) and the CAIN-III near-IR camera in Tenerife, Spain. The photometric zero-points and colour equations were determined by exploiting the 2MASS stars that are present in the field. The near-IR magnitudes are also listed in Table 1. The source was also detected at longer wavelengths. It is catalogued as IRAS 20570+5021, and the corresponding flux densities are F12 = 6.06, F25 = 3.26, F60 < 0.81, and F100 < 8.69 Jy. The Midcourse Space Experiment (MSX) provides the following flux densities: F8.28 = 5.43 ± 0.22 Jy, F12.13 = 4.88 ± 0.25 Jy, F14.65 = 3.75 ± 0.23 Jy, and F21.34 = 2.45 ± 0.17 Jy. It is also reported in the AKARI/IRC All-Sky Survey Point Source Catalogue with the following flux densities: F9 = 4.78 ± 0.26 Jy and F18 = 3.05 ± 0.19 Jy.
Optical and near-IR photometric data.
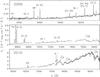 |
Fig. 1 2006 (upper and middle rows) and 2010 (bottom panel) spectra of IPHAS J205836.43+503307.2. Only the regions with reliable flux calibration are plotted. Note the different x- and y-scales in the various panels. The regions around 6870 Å and 7600 Å containing the O2 atmospheric absorption bands are not plotted. |
3. Analysis
3.1. Emission-line spectrum
The 2006 and 2010 low-resolution spectra of the source are presented in Fig. 1. In 2006, the spectrum showed narrow emission lines from low (e.g. [O i], [Fe ii], [S ii]) to high ([O iii], He ii, [Ca v], [Fe vii]) ionization species. They are listed in Table 2: observed line fluxes Fobs are given relative to FHβ = 100, and the estimated Hβ flux is 4.9 × 10⁻¹⁶ erg cm-2 s-1. The error on the absolute flux of Hβ is 20%, caused by a lack of precise absolute flux calibration for these data. The errors in the quoted fluxes (relative to Hβ) for the other lines are ~5% for lines stronger than 0.5 FHβ, and are larger for fainter lines. The emission-line spectrum is for instance similar to that of the recently discovered D-type symbiotic star K 3-22 (Corradi & Giammanco 2010), but with stronger low-excitation forbidden lines such as [N ii], [S ii], or [O i].
Emission line fluxes observed in 2006, relative to FHβ = 100.
For any reddening value and standard interstellar extinction laws, the Balmer Hα, Hβ, and Hγ lines do not show the theoretical ratios expected for low-density nebulae (Ne ≤ 107 cm-3, Brocklehurst 1971; Krolik & McKee 1978). For higher densities, the intrinsic line ratios become a complex function of Ne, Te, and optical depth (Drake & Ulrich 1980). A high Hα/Hβ ratio as observed in IPHAS J205836.43+503307.2 (=27) can be produced for large optical depths in the Balmer lines (τHα ≥ 100) and/or relatively high densities (106 ≤ Ne ≤ 1010 cm-3). At higher densities the ratio decreases again (Drake & Ulrich 1980). The Hγ/Hβ ratio has a complex behaviour, but remains at a level closer to the low-density case for Ne < 108 cm-3 unless τHα is very high. Without reliable density, temperature, and optical depth indicators for IPHAS J205836.43+503307.2, the estimate of accurate intrinsic ratios for the Balmer lines, and hence the calculation of the reddening, is precluded. Even so, if we take Ne < 1010 cm-3 for the region where the bulk of the H i is emitted, the observed Hγ/Hβ ratio (=0.3) provides an upper limit of 4 mag to the reddening in the V band, using the Fitzpatrick (2004) extinction law. We take this figure as the upper limit to the interstellar reddening of IPHAS J205836.43+503307.2.
Figure 2 shows the profiles of the lines around Hα. The signal-to-noise ratio is limited, but clearly both the Hα and [N ii]6583 line profiles are complex, with multiple components that make the determination of the systemic velocity vsys of IPHAS J205836.43+503307.2 uncertain. A single-Gauss fit to Hα and the mean value of the two-Gaussian fit of the [N ii]6583 line would indicate a value vsys = −27 ± 10 km s-1, corrected to the local standard of rest, but this number should be taken with caution. Should the system participate in the general circular rotation around the Galactic centre, this systemic velocity would imply a distance of 3.0 ± 0.8 kpc (Brand & Blitz 1993). The Hα profile has a full-width-at-zero intensity of 180 km s-1. Its articulated shape, the absence of extended wings, and the presence of a relatively strong [N ii] emission, is visible in several D-type symbiotic stars such as R Aqr or He 2-104. This profile corresponds to type D-1 in the classification scheme of van Winckel et al. (1993).
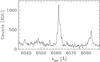 |
Fig. 2 High-resolution spectrum around Hα of November 2010. |
3.2. Resolving the nebular component
Most of the forbidden lines observed in the spectrum of IPHAS J205836.43+503307.2 have critical densities for collisional quenching of the order of Ne ~ 106 cm-3. They are likely to form in regions more extended and less dense than the nebular/stellar core where most of the H i is emitted (see e.g. Corradi & Schwarz 2003). Indeed, the excellent seeing of the 2010 WHT spectrum allows us to resolve the inner nebula. In this spectrum, obtained with the slit orientated at a position angle 97°, the full-width-at-half maximum (FWHM) of the source along the spatial direction is 07 at wavelengths dominated by the stellar continuum (line-free). The spatial profile of Hα and more clearly of the nearby [N ii] and [S ii] doublets is instead broader with non-Gaussian extended wings, indicating that the gas emitting region is partly resolved (Fig. 3, top). This is best seen in the [N ii]6583 line, because of the relatively weaker contribution from the unresolved core. The bottom panel of Figure 3 shows the observed spatial profile of [N ii]6583 (dotted line), the profile of the continuum at adjacent wavelengths (dashed line), and the continuum-subtracted [N ii] profile (thick red solid line). The latter is fairly well fitted by a Gaussian of 19 FWHM, or 18 after seeing deconvolution. This figure would underestimate the true nebular diameter by a factor from 1.2 to 1.6 for standard morphologies (thin or thick shells, disc, see van Hoof 2000). Taking an intermediate correction factor, the resulting size of 25 corresponds to a linear diameter ≥ 0.05 pc for a distance larger than 4 kpc (see Sect. 3.4). Such a compact nebula might be similar to those around the symbiotic Miras Hen 2-147 (Munari & Patat 1993; Santander-García et al. 2007) or RX Pup (Corradi & Schwarz 2003).
The seeing in the original IPHAS images (12) and the width of the Hα filter used (95 Å), which increases the relative contamination from the point-like core, prevented a clear detection of the extended nebula in those data. A careful analysis of the point-spread function in the images shows that the source is indeed marginally resolved, with weak evidence for elongation roughly along the east-west direction.
In the WHT spectrum, a slight tilt of the emission line is also visible. The brighter eastern side of Hα, [N ii] and [S ii] is redshifted with respect to the fainter western side by 1.0 ± 0.3 Å, or 45 ± 15 km s-1. This corresponds, at least partially, to the velocity components in the spatially-unresolved [N ii] profile of the high-resolution spectrum of Fig. 2. The observed velocity structure indicates that the nebula is not spherical: an axisymmetrical or ring-like morphology as commonly observed in symbiotic stars (Corradi 2003) is suggested. Imaging at sub-arcsec resolution through a narrow [N ii] filter is needed to gain more information about the extension and morphology of the circumstellar nebula of IPHAS J205836.43+503307.2.
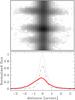 |
Fig. 3 Top: zoom of the long-slit WHT spectrum around Hα (middle spectral line) and the [N ii] doublet. The wavelength increases from bottom to top. The slit was positioned at PA = 97°, and East is towards the left. The size of the box in the spatial direction is as in the bottom panel. Bottom: spatial profile of the [N ii]6583 line. The observed profile is indicated by the dotted line, the adjacent stellar continuum by the dashed line, and the continuum-subtracted [N ii] profile by the thick (red) solid line. |
3.3. The stellar continuum
In the 2006 spectrum, a red continuum is observed. It shows the absorption bands that are typical of a carbon-rich star, in particular the CN band starting at 7845 Å. In 2010, the stellar continuum has significantly brightened, by roughly the same amount as determined comparing the 2003 and 2010 photometry. Within the errors, the Hα line flux has not varied from 2006 to 2010, but the flux of the [N ii] and [S ii] doublets is about twice as large.
The redder setup of the 2010 spectrum includes spectral features sensitive to the stellar temperature in carbon stars. The strong K i absorption lines at 7665 and 7699, together with the absence of the Ca ii infrared triplet, and in particular of the Ca ii 8662 line, puts the object at the cool end of the carbon star sequence (Richer 1971), with a temperature Teff ~ 2000 K (Bergeat et al. 2001). This corresponds to spectroscopic class C9 (Richer 1971), or photometric class CV7 (Knapik et al. 1999). A large percentage of sources with these characteristics are variables at the tip of the asymptotic giant branch (AGB): i.e. Miras or semi-regular variables (Knapik et al. 1999).
3.4. Photometry
The photometric data available before the present season were obtained in 1999 in the near-IR (J, H, and Ks bands, 2MASS) and in 2003 in the red (r′ and i′, IPHAS). A comparison with the present measurements shows that the brightening of the source has been significant, from 2.1 mag (Ks and r′) up to 3.8 mag in J1 (cf. Table 1). While the r′ − i′ colour has become redder, in the near-IR IPHAS J205836.43+503307.2 is now substantially bluer than eleven years ago. As shown in the previous sections, the main cause of the variation is the increase in brightness of the carbon star. In the optical, the contribution of the ionized nebula is much larger in the r′ band than in i′: assuming that the cool star has brightened but the nebula did not vary much would explain the redder r′ − i′ colour observed in 2010. Sticking to the near-IR data where the nebular contribution is negligible, and correcting for the upper limit of the interstellar extinction estimated above, we obtain that in 2010 (J − H)0 > 1.8 and (H − KS)0 > 1.3.
These colours are typical of carbon Miras (see Fig. 1 in Whitelock 2000). These stars, and in particular those with moderate-to-thick dust shells, display large-amplitude, long-term photometric variations in addition to the conspicuous light modulation caused by pulsations (Whitelock et al. 1997). The long-term variations are often associated with periodic or erratic dust formation/obscuration episodes (Whitelock 2000), but orbital effects in a binary system have also been invoked, e.g., for V Hya (Knapp et al. 1999). The combination of pulsations and long-term variability observed in other carbon Miras is indeed consistent with the large photometric changes of IPHAS J205836.43+503307.2 in the last decade. Its even more extreme colours in 1999, (J − H)0 > 2.7 and (H − KS)0 > 2.1, are characteristic of carbon Miras with thick dust shells like IRC+10216, V688 Mon, or IZ Peg. Such a strong near-IR excess is ascribed to the combination of extinction and thermal emission from dust grains in circumstellar shells of a substantial optical depth (Knapik et al. 1999). The [12] − [25] IRAS colour of the source is also consistent with a classification as a carbon Mira (Whitelock et al. 1997).
Indeed, a slow variability was detected over a period of 60 days between November 2010 and January 2011 (Table 1 and Fig. 4). The observed luminosity decrease might be caused by the Mira pulsations, but it is premature to draw conclusions based on this two-month monitoring. Combining these data with the 2003 IPHAS measurements and with the available near-IR photometry should be done with caution, given the above-mentioned additional variability related to dust formation events, which are common in these stars and are indicated in IPHAS J205836.43+503307.2 by the variations of its near-IR magnitude and colour (ΔJ = 3.8 mag, Δ(J − KS) = 1.6 mag), which are larger than expected from Mira pulsation only (see Tables 2 and 3 of Whitelock et al. 2006).
With the hypothesis that the cool giant is indeed a Mira, some rough limits to the distance of IPHAS J205836.43+503307.2 can be derived. We assume that the shape of the light curve in Fig. 4 indicates that the star was near maximum at the end of 2010 (Kmax = 6.1 mag). In addition, the data in Table 3 of Whitelock et al. (2006) show a correlation between the pulsational period and amplitude of the light curve in the K-band for carbon Miras. This relation provides a way to estimate the mean magnitude of the carbon star of IPHAS J205836.43+503307.2 throughout a pulsational cycle. For a period P = 300 days (unlike given the slow variability in Fig. 4), a mean magnitude Kmean = 6.3 mag is derived. For P = 800 days, Kmean = 7.1 mag. A reddening AK ~ 0.8 mag of the carbon Mira at the end of 2010 was estimated by adopting from Bergeat et al. (2001) the intrinsic mean J − KS colour of carbon stars with Teff ~ 2000 K (see Sect. 3.3). The application of the period-luminosity relationship of Whitelock et al. (2008) results in a distance of 4 kpc if P = 300 days, and 11 kpc if P = 800 days.
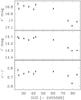 |
Fig. 4 Photometric behaviour of IPHAS J205836.43+503307.2 from November 2010 to January 2011. |
4. Conclusions
Our observations indicate that IPHAS J205836.43+503307.2 is a new symbiotic star of the D-type with a carbon-rich cool giant, likely a carbon Mira. Only two other Galactic symbiotic stars are known to have a carbon Mira. They are SS 38 and AS 210 (Gromadzi et al. 2009). Both show an emission-line spectrum (including the 6825 Å Raman scattered feature) stronger than in IPHAS J205836.43+503307.2, and have warmer cool giants (SS 38 being the most similar). The other candidates in the catalogue of Belczyński et al. (2000), StHα-55 (Munari et al. 2008) and UV Aur (e.g. Herbig 2009), were instead shown not to be symbiotic stars. New data are needed to confirm the carbon Mira V335 Vul as a symbiotic star.
Summarising, IPHAS J205836.43+503307.2 seems to belong to a rare group of stars in the Galaxy: carbon Miras in interacting binary systems. Its 2000 K giant with a thick circumstellar dust shell locates it at the tip of the AGB, about to loose its entire envelope. The object and its resolved ionized nebula can provide valuable information about the effects of a close companion on aspects like the pulsational properties of carbon Miras, the cause of long-term periodic photometric variations (how many of them are related to binarity?), the mass loss geometry and its timescales (highly relevant to the formation of asymmetric outflows in evolved stars and related nebulae). This is particularly important given the limited information available on carbon Miras in general (cf. Knapik et al. 1999). To reach these goals, multi-wavelength photometric monitoring should continue to confirm the presence of a Mira variable in IPHAS J205836.43+503307.2, determine its pulsational period (and hence the distance of the system using the period-luminosity relation), separate pulsations from long-term variability caused by dust obscuration events, and compare the main properties of the system with other binary and single carbon Miras.
Extended nebulae are common in D-type symbiotic Miras (Corradi 2003), but they were not previously detected around carbon-rich symbiotic stars. These nebulae are thought to be mainly composed of red giant wind that is not accreted by the white dwarf companion. A study of the properties and chemical composition of the nebula of IPHAS J205836.43+503307.2 would be of great value to test its origin, and perhaps reveal chemical changes in the carbon star in the last ~104 years. Finally, the parameters of the binary system (distance, stellar masses and luminosities, orbital period) should also be determined by a variety of methods. With a lot of patience, though, given the long orbital, pulsational, and dust-evolution timescales of these systems.
This is likely the band in which the cool giant continuum is less affected by the combined contribution of the hot companion, ionized nebula, and circumstellar dust emission.
Acknowledgments
R.L.M.C. and A.M. acknowledge funding from the Spanish AYA2007-66804 grant. RA acknowledges a grant from the FONDECYT Project N. 3100029. This paper makes use of data obtained as part of the INT Photometric Hα Survey of the Northern Galactic Plane (IPHAS) carried out at the Isaac Newton Telescope (INT). All IPHAS data are processed by the Cambridge Astronomical Survey Unit, at the Institute of Astronomy in Cambridge.
References
- Belczyński, K., Mikolajewska, J., Munari, U., et al. 2000, A&AS, 146, 407 [NASA ADS] [CrossRef] [EDP Sciences] [Google Scholar]
- Bergeat, J., Knapik, A., & Rutily, B. 2001, A&A, 369, 178 [NASA ADS] [CrossRef] [EDP Sciences] [Google Scholar]
- Brand, J., & Blitz, L. 1993, A&A, 275, 67 [NASA ADS] [Google Scholar]
- Brocklehurst, M. 1971, MNRAS, 153, 471 [NASA ADS] [CrossRef] [Google Scholar]
- Corradi, R. L. M. 2003, in Symbiotic stars probing stellar evolution, ed. R. L. M. Corradi, J. Mikolajewska, & T. J. Mahoney, ASP Conf. Ser., 303, 393 [Google Scholar]
- Corradi, R. L. M., & Giammanco, C. 2010, A&A, 520, A99 [NASA ADS] [CrossRef] [EDP Sciences] [Google Scholar]
- Corradi, R. L. M., & Schwarz, H. E. 2003, A&A, 363, 674 [Google Scholar]
- Corradi, R. L. M., Rodríguez-Flores, E. R., Mampaso, A., et al. 2008, A&A, 480, 409 [NASA ADS] [CrossRef] [EDP Sciences] [Google Scholar]
- Corradi, R. L. M., Valentini, M., Munari, U., et al. 2010a, A&A, 509, A41 [NASA ADS] [CrossRef] [EDP Sciences] [Google Scholar]
- Corradi, R. L. M., Munari, U., Greimel, R., et al. 2010b, A&A, 509, L9 [NASA ADS] [CrossRef] [EDP Sciences] [Google Scholar]
- Drake, S. A., & Ulrich, R. K. 1980, ApJS, 42, 351 [NASA ADS] [CrossRef] [Google Scholar]
- Drew, J., Greimel, R., Irwin, M. J., et al. 2005, MNRAS, 362, 753 [NASA ADS] [CrossRef] [Google Scholar]
- Di Stefano, R. 2010, ApJ, 719, 474 [NASA ADS] [CrossRef] [Google Scholar]
- Fitzpatrick E. L., 2004, in Astrophysics of Dust, ed. A. N. Witt, G. C. Clayton, & B. T. Draine, ASP Conf. Ser., 309, 33 [Google Scholar]
- Gromadzki, M., Mikolajewska, J., Whitelock, P., & Marang, F. 2009, Acta Astron., 59, 169 [NASA ADS] [Google Scholar]
- Herbig, G. H. 2009, AJ, 138, 1502 [NASA ADS] [CrossRef] [Google Scholar]
- Knapik, A., Bergeat, J., & Rutily, B. 1999, A&A, 344, 263 [NASA ADS] [Google Scholar]
- Knapp, G. R., Dobrovolsky, S. I., Ivezic, Z., et al. 1999, A&A, 351, 97 [NASA ADS] [Google Scholar]
- Krolik, J. H., & McKee, C. F. 1978, ApJS, 37, 459 [NASA ADS] [CrossRef] [Google Scholar]
- Kohoutek, L., & Wehmeyer, R. 1999, A&AS, 134, 255 [NASA ADS] [CrossRef] [EDP Sciences] [Google Scholar]
- Munari, U., & Patat, F. 1993, A&A, 277, 195 [NASA ADS] [Google Scholar]
- Munari, U., & Renzini, A. 1992, AJ, 397, 87 [Google Scholar]
- Munari, U., Siviero, A., Graziani, M., et al. 2008, Baltic Astron., 17, 301 [NASA ADS] [Google Scholar]
- Oke, J. B. 1990, AJ, 99, 1621 [NASA ADS] [CrossRef] [Google Scholar]
- Richer, H. B. 1971, ApJ, 167, 521 [NASA ADS] [CrossRef] [Google Scholar]
- Santander-García, M., Corradi, R. L. M., Whitelock, P. A., et al. 2007, A&A, 465, 481 [NASA ADS] [CrossRef] [EDP Sciences] [Google Scholar]
- van Hoof, P. A. M. 2000, MNRAS, 314, 99 [NASA ADS] [CrossRef] [Google Scholar]
- van Winckel, H., Duerbeck, H. W., & Schwarz, H. E. 1993, A&AS, 102, 401 [NASA ADS] [Google Scholar]
- Whitelock P. A., 2000, IAU Symp. 177, ed. R. F. Wing (Dordrecht: Kluwer Academic Publishers), 179 [Google Scholar]
- Whitelock, P. A., Feast, M. W., Marang, F., & Overbeek, M. D. 1997, MNRAS, 288, 512 [NASA ADS] [CrossRef] [Google Scholar]
- Whitelock, P. A., Feast, M. W., Marang, F., & Groenewegen, M. A. T. 2006, MNRAS, 369, 751 [NASA ADS] [CrossRef] [EDP Sciences] [Google Scholar]
- Whitelock, P. A., Feast, M. W., & van Leeuwen, F. 2008, MNRAS, 386, 313 [NASA ADS] [CrossRef] [Google Scholar]
All Tables
All Figures
|
Fig. 1 2006 (upper and middle rows) and 2010 (bottom panel) spectra of IPHAS J205836.43+503307.2. Only the regions with reliable flux calibration are plotted. Note the different x- and y-scales in the various panels. The regions around 6870 Å and 7600 Å containing the O2 atmospheric absorption bands are not plotted. |
| In the text | |
|
Fig. 2 High-resolution spectrum around Hα of November 2010. |
| In the text | |
|
Fig. 3 Top: zoom of the long-slit WHT spectrum around Hα (middle spectral line) and the [N ii] doublet. The wavelength increases from bottom to top. The slit was positioned at PA = 97°, and East is towards the left. The size of the box in the spatial direction is as in the bottom panel. Bottom: spatial profile of the [N ii]6583 line. The observed profile is indicated by the dotted line, the adjacent stellar continuum by the dashed line, and the continuum-subtracted [N ii] profile by the thick (red) solid line. |
| In the text | |
|
Fig. 4 Photometric behaviour of IPHAS J205836.43+503307.2 from November 2010 to January 2011. |
| In the text | |
Current usage metrics show cumulative count of Article Views (full-text article views including HTML views, PDF and ePub downloads, according to the available data) and Abstracts Views on Vision4Press platform.
Data correspond to usage on the plateform after 2015. The current usage metrics is available 48-96 hours after online publication and is updated daily on week days.
Initial download of the metrics may take a while.