Free Access
Fig. 1
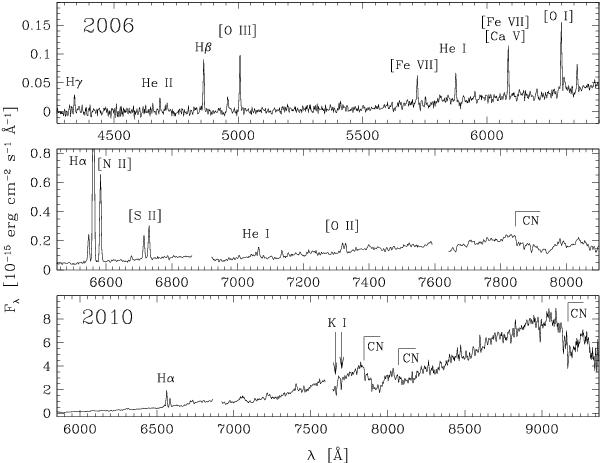
2006 (upper and middle rows) and 2010 (bottom panel) spectra of IPHAS J205836.43+503307.2. Only the regions with reliable flux calibration are plotted. Note the different x- and y-scales in the various panels. The regions around 6870 Å and 7600 Å containing the O2 atmospheric absorption bands are not plotted.
Current usage metrics show cumulative count of Article Views (full-text article views including HTML views, PDF and ePub downloads, according to the available data) and Abstracts Views on Vision4Press platform.
Data correspond to usage on the plateform after 2015. The current usage metrics is available 48-96 hours after online publication and is updated daily on week days.
Initial download of the metrics may take a while.