Fig. 3
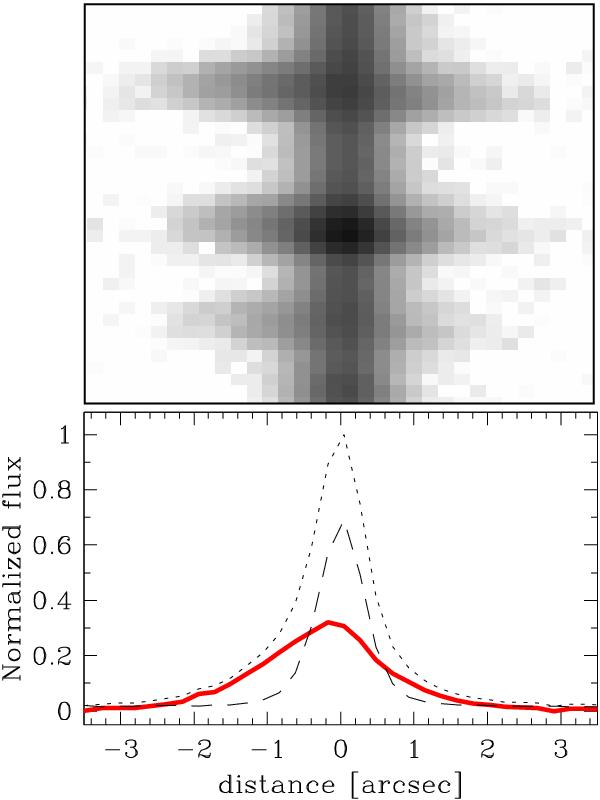
Top: zoom of the long-slit WHT spectrum around Hα (middle spectral line) and the [N ii] doublet. The wavelength increases from bottom to top. The slit was positioned at PA = 97°, and East is towards the left. The size of the box in the spatial direction is as in the bottom panel. Bottom: spatial profile of the [N ii]6583 line. The observed profile is indicated by the dotted line, the adjacent stellar continuum by the dashed line, and the continuum-subtracted [N ii] profile by the thick (red) solid line.

Current usage metrics show cumulative count of Article Views (full-text article views including HTML views, PDF and ePub downloads, according to the available data) and Abstracts Views on Vision4Press platform.
Data correspond to usage on the plateform after 2015. The current usage metrics is available 48-96 hours after online publication and is updated daily on week days.
Initial download of the metrics may take a while.