| Issue |
A&A
Volume 529, May 2011
|
|
|---|---|---|
| Article Number | A7 | |
| Number of page(s) | 8 | |
| Section | Astrophysical processes | |
| DOI | https://doi.org/10.1051/0004-6361/201015810 | |
| Published online | 21 March 2011 | |
Research Note
Viscous timescale in high mass X-ray binaries
Physics DepartmentMiddle East Technical University, 06531 Ankara, Turkey
e-mail: This email address is being protected from spambots. You need JavaScript enabled to view it.
Received: 23 September 2010
Accepted: 5 February 2011
Abstract
Context. Low mass X-ray binaries are found to have very low frequency breaks in their power density spectra. The power density spectra below these breaks are nearly in white noise structure and at higher frequencies approximately follow the Pν ∝ ν-1.3 law.
Aims. To determine whether high mass X-ray binary power density spectra have similar properties and the findings for low mass X-ray binaries are also valid for high mass binaries, we analyzed the time series of high mass X-ray binary sources produced by All Sky Monitor of Rossi X-ray Timing Explorer.
Methods. We obtained the power density spectra of the high mass X-ray binaries using the cosine transform of autocorrelation function.
Results. We identified break frequencies for seven sources, namely OAO 1657-415, SS 433, Vela X-1, SMC X-1, 4U 1700-377, GX 301-2, and LMC X-1. The normalized break frequencies with respect to the orbital frequency (fbreak/forbit) for sources OAO 1657-415, SS 433, SMC X-1 and LMC X-1 are consistent with those of Roche lobe overflow systems. The other high mass X-ray binary systems, Vela X-1, GX 301-2, and 4U 1700-377, however, have larger break frequency ratios, fbreak/forb, which are indicative of short viscous times. These are all wind-accreting sources and the stellar winds in the systems allow the formation of only short radius discs. Consequently, we qualitatively distinguished the Roche lobe overflow binaries from the wind accreting system by comparing their normalized break frequencies.
Key words: accretion, accretion disks / X-rays: binaries
© ESO, 2011
1. Introduction
X-ray binaries have X-ray flux variations on a broad range of timescales. In a binary system the transfer of matter through an accretion disc is considered to be dominated by viscous forces. These modify the disc structure on a viscous timescale. Hence, the response of the disc to any external change occurs on this longest timescale of the disc. If the frequency of a variation is lower than tvisc(Rd)-1 ~ fbreak, the corresponding X-ray flux variations are considered to be uncorrelated; therefore, the corresponding power density spectrum is expected to exhibit a white noise behavior at these frequencies.
In this study, we find significant break frequencies in OAO 1657-415, SS 433, Vela X-1, SMC X-1, 4U 1700-377, GX 301-2, and LMC X-1. In the following section, we explain the selection criteria and our sample of X-ray binaries. We also describe the techniques we used to obtain the power density spectra, and then determine the break frequencies together with the power law indices. Discussion of our results is given in Sect. 3.
2. Data and analysis
2.1. Data
We used data gathered by the All Sky Monitor (ASM) instrument of Rossi X-ray Timing Explorer (RXTE) observatory, covering the period from 1996 to 2010. The ASM instrument operates in the 2 − 12 keV energy range, performs flux measurements for over ~500 X-ray sources, and scans 80% of the sky every 90 min. Each flux measurement has a duration of ~90 s. Some gaps sometimes appear in time of duration as long as a few months in the light curves of ASM sources because of navigational constrains and the appearance of very bright transient sources. The dwell-by-dwell light curves were retrieved from the public RXTE/ASM archive at HEASARC.
We derived the power density spectra (PDS) of the sources from the cosine transform of the discrete autocorrelation function. We also estimated the PDS using HEASARC software “powspec” with Miyamoto normalization (Miyamoto et al. 1992) in our data analysis. Both estimates of PDS give consistent results.
2.2. Sources
We constructed our sample after evaluating the PDS of light curves for 45 high mass X-ray binaries with known orbital periods.
The binary parameters for LMXBs from the ASM sample.
The parameters of power spectrum approximation.
-
(i)
We selected only persistent sources that are in the same stateduring the observation period. Twenty-five HMXRBs in oursample are Be transients that are not persistent X-ray sourcesand display outbursts because of the extremely wide eccentricorbit of neutron stars around their companions. Owing to theshort outburst time span relative to the orbital period, we do not seebreaks in their PDS. Outburst phases are the cause of substantialred noise in their PDS. Two sources Cen X-3 andCyg X-1 have low frequency breaks in their PDS. However, thesesources have significant signatures of high-low states in theirlight curves. These state transitions contaminate the long-termpower density spectra, so that fake breaks may appear. To seethese artificial effects, we carried out simulations as describedbelow in (iii). In addition, we refer to Fig. 2 for thecomparison between the PDS obtained from the real light curveand the simulated light curve. While creating the fake light curve,we took into account the state transitions of the source. Althoughwe produced this light curve from a PDS obeying a power lawtrend (i.e. no breaks), it is clear from the figure that the simulatedPDS resembles the real PDS. Hence, we estimate that the breaksin these sources are associated with the occurrence of high-lowintensity states rather than the viscous time of the disc.
-
(ii)
The sources with very low count rates, <1 count/s, such as LMC X-4 or 4U1538-52, have white-noise-dominated power density spectra at low frequencies.
-
In our analysis, we found that the remaining seven sources had low frequency breaks in their PDS together with power-law indices ~1.3. These are OAO 1657-415, SS 433, Vela X-1, SMC X-1, 4U 1700-377, GX 301-2, and LMC X-1. These values for α indices imply the existence of accretion discs (Lyubarskii 1997). In Figs. 1 and 3 and Table 1 light curves, PDS and orbital parameters of the sources are presented, respectively. We marked the orbital and super-orbital periods of the sources on the power density spectra. Although these modulations are quite clear as peaks at the corresponding frequencies, it is not possible to determine their values from the PDS accurately since we use geometrical binning and the resolutions of the PDS are low. Table 2 contains the break frequencies and power-law indices of the sources. Power spectra of light curves of the sources show that there are periodic modulations in the luminosity of the sources that are caused by both the orbital motion of the system and the quasi-periodic/periodic modulation due to the precession of accretion disc. To see whether the low frequency breaks, which we saw in the PDS of the HMXBs, are the results of such periodic/quasi-periodic variability in the X-ray flux, we carried out simulations using the orbital period and precession periods of each source. In simulating the light curves of each source, we took Fourier amplitudes from the real power spectra, and for the phases of Fourier amplitudes, we used Gaussian white noise with unit variance. We sampled the light curves of each source as if observed by ASM such that their power densities are consistent with the power law P ~ f-1.3. We then convolved these time series by introducing periodic signals for both the orbital motion and precession period if the source had a periodicity. Consequently, using the simulated light curves we constructed the power density spectrum. In our simulations, we did not see any breaks due to the orbital or precession modulation of light curves. The simulation result for Vela X-1 is presented in Fig. 2. Other short-term variations, such as flickering and magnetic field effects on the inner disc, appear at high frequencies, i.e. higher than our Nyquist frequency > 1.0 × 10⁻⁴ Hz, so they do not “pollute” the low frequency power density spectra we analyze. These short-term variations are the subject of independent research. (For magnetic effects, see Revnivtsev et al. 2009.) Therefore, all of the seven sources were chosen for further analysis in this work.
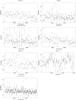 |
Fig. 1 Long-term light curves of the high-mass X-ray binaries. |
3. Discussion
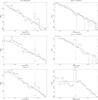 |
Fig. 2 On the left side, the simulation results of Cen X-3 is presented. The top figure is the power density spectrum in power law with orbital modulation, the middle one is the same as the former but the state transitions are taken into account, and the bottom figure is the real PDS of Cen X-3. On the right side, the simulation results of Vela X-1 is presented. The top figure is the power spectrum only in power law, the middle one is the PDS in power law with orbital modulation, and the bottom figure is the real PDS of Vela X-1. It is clear from the figures that sinusoidal orbital modulation does not affect the trend of the power law, but the state transitions cause an artificial break in the PDS. |
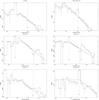 |
Fig. 3 Power density spectra of high mass X-ray binaries with the best power-law models (the PDS of Vela X-1 is presented in Fig. 2 at the bottom right corner). |
The primary goals of this work are to study the low-resolution PDS of HMXBs and both resolve low frequency breaks and distinguish them on the basis of their accretion properties. According to the standard theory of the alpha disc model (Shakura & Sunayev 1973), the viscous timescale of accretion disc (inverse break frequency) tvisc = 1/fvisc ~ 1/fbreak is proportional to the orbital period and this proportionality is given by 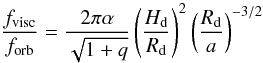 (1)where α is the viscosity parameter and H/R is the ratio of disc thickness to outer disc radius, q is the mass ratio M2/M1, and a is the binary separation.
In Fig. 4, we presented the correlation between the break frequency and orbital frequency of HMXBs as well as the LMXBs observed by (Gilfanov & Arefiev 2005) for various H/R and q values. The figure also contains the theoretical predictions of the α-disc model for the viscous time-orbital frequency correlation for various mass ratios, q. For the theoretical estimations, we used Eq. (1) and 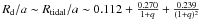 (Paczynski 1977). The shaded region covers the mass ratio range 2.91 ≤ q ≤ 22.77 for α = 0.5. The dashed lines are the predictions for larger values of the disc thickness, H/R, than those proposed by Shakura & Sunyaev (1973), again with α = 0.5 and q values indicated on the plot.
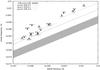 |
Fig. 4 The relation between the PDS break frequency and the orbital frequency of the binary system. The large shaded area toward the bottom of the plot is the widest region possible for the dependence fvisc vs. forb according to the α-disc, obtained from Eq. (1) in the mass ratio range 2.91 ≤ q ≤ 22.77 for α = 0.5. The dashed lines are predictions for larger values of the disc thickness H/R with α = 0.5 and q values indicated on the plot. Most of the errors in fbreak are on the order of marker (or symbol) size. |
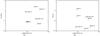 |
Fig. 5 a) Dependence of the ratio fbreak/forb on the orbital period of the binary system. Some of the errors in fbreak/forb are on the order of the marker (or symbol) size. b) Relation of the normalized outer disc radius to the orbital period of the system. The arrows represent the possible ranges of the outer disc radii (Blondin 2000). |
In Fig. 5a, we plotted the normalized break frequencies, fbreak/forb, against the orbital periods. In this figure, it can clearly be seen that, for Vela X-1, 4U 1700-377, and GX 301-2, the normalized break frequency is greater than for other sources (see Table 2). For this group of sources, normalized break frequencies are in the range 0.76-2.56, whereas for SS 433, SMC X-1, GX 301-2, and OAO 1657-415 these values are in the range 0.076-0.16. The ratios of the normalized frequencies of the HMXBs in the former group to those in the latter group range between 5 and 33.
If the normalized break frequencies are associated with viscosity times, then Vela X-1, 4U 1700-377, and GX 301-2 should have tiny discs with respect to the other sources.
There should be some reasons for this distinction regarding the properties of accretion processes in these binaries. Since we investigate high mass X-ray binaries, there are two main accretion mechanisms: Roche lobe overflow and stellar wind accretion. Roche lobe overflow leads to persistent disc formation around the compact object. On the other hand, thin accretion discs may appear in the course of wind accretion. Among our sources, SS 433 and SMC X-1 have been determined to be Roche-lobe overflow binaries, Vela X-1, GX 301-2 and 4U 1700-377 involve wind-driven accretion mechanism, and for the rest, namely OAO 1657-415 and LMC X-1, there are remaining uncertainties about the nature of accretion mechanisms since they have been observed to show signs of both Roche-lobe and wind accretion. To understand these categories more clearly, we investigate in the following section the accretion properties of each source.
3.1. Vela X-1
Vela X-1 is considered to include a pulsar accreting from the violent wind of the supergiant companion. It has been observed to exhibit rapid variations in the periodicity of its X-ray pulses, which are indicative of spin-up and spin-down phases for its rotation (Deeter et al. 1989) and this variability is attributed to the torque reversals on the pulsar caused by the change in direction of the gas rotation in the temporary accretion disc. This temporary disc has been shown, by simulations, to form due to the flip-flop instability of the accretion shock from the stellar wind to the pulsar (Blondin & Pope 2009). Boynton et al. (1984) reported a duration of 2 − 3 days for accretion torque reversals of Vela X-1, which is close to the viscous time inferred from our estimate of break frequency. Hence, the resulting disc is very unstable and cannot extend to a large radius in the observed 2 − 3 days as its dispersion is dominated by viscosity.
We estimate the inner and outer radii of a possible accretion disc. The magnetic field of the pulsar is rather high, ~ 1012 − 1013 G, which that means an accretion disc is limited by the Alfv n radius from inside given approximately by (Frank et al. 2002)
  (2)where m1 = Mn/M⊙, Rn = R6 × 106 cm, L = L37 × 1037 erg/s, and the magnetic moment of the pulsar
  . Thus, for the Vela pulsar,
  cm. There is no distinctive analytical or numerical expression for the outer radii of accretion discs of wind-driven HMXBs, but the upper limit to a possible disc radius is considered to be determined by the tidal forces and Rtidal ≃ 0.9RL independent of the characteristics of the disc (RL is the Roche-lobe radius of the compact star). The Roche-lobe radii are calculated analytically using the expression of Eggleton (1983)
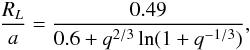 (3)which implies that Rtidal ≃ 6.0 × 1011 cm. In other words, if an accretion disc were to form, its radius should be greater than the Alfvn radius and smaller than the tidal radius. This limitation is consistent with our findings since we estimate the outer disc radius to be ≃ 4 × 109 cm using our value for the fbreak/forb ratio, 2.56, in the theoretical expression for fvisc/forb, derived from the Shakura-Sunyaev disc model with a thin disc approximation.
We estimated the upper limit to the outer disc radii of the other sources with the same procedure. Simulations carried out by Blondin (2000) estimate the disc radius to be smaller than our calculations. The limitation depends on many parameters such as mass ratio, temperature, Mach number, etc. For example, the sizes of warmer discs can be smaller by as much as 30%. Nevertheless, these deviations would not change the appearance of our results presented in Fig. 5b as a plot of normalized disc radius versus orbital period.
3.2. GX 301-2
The mass ratio of GX 301-2 is similar to that of Vela X-1, which is ~21.7. It has a highly eccentric orbit, e ~ 0.467 (Sato et al. 1986) with orbital period 41.5 days. The source experienced some spin-up episodes since 1984, which are interpreted as the signs of the formation of equatorial accretion discs from tidal streams found to last for ~20 days by Koh et al. (1997), twice in an orbital period. Our analysis yielded an inverse break frequency that corresponds to ~11 days. The duration of the temporary accretion disc and the timescale we obtained from its break frequency are of the same order implying that it has a small accretion disc, as Fig. 5b also indicates.
3.3. 4U 1700-377
4U 1700-377 is an X-ray eclipsing binary system with an orbital period of 3.4 days (Jones et al. 1973). The mass of the compact object of the system was found to be ~2.44 M⊙ (Clark et al. 2002); however, it is still unclear whether it is a neutron star or a black hole since no X-ray periodicity has been detected that may correspond to the pulse period of a neutron star. Nevertheless, it is more common to accept that it is a neutron star owing to the similarity of its X-ray spectrum to those of accreting neutron stars, and account for the lack of pulsations as a result of either a weak magnetic field or an alignment of the magnetic field with the spin axis (Clark et al. 2002).
The accretion process is considered to be driven by a wind flow rather than the Roche-lobe overflow because the companion star, HD 153919, under-fills its Roche lobe (Conti 1978). Moreover, the ~13.8 day variations in the X-ray emission and episodic detection of QPOs appear to indicate the formation of a short-scale transient disc (Hong & Hailey 2004). Its break frequency value corresponds to ~4.4 days. The normalized break frequency, 0.76, is only a factor of 2 − 3 smaller then Vela X-1 and GX 301-2, which indicates that its accretion disc may be of similar size for these sources. This can also be deduced from its location in Fig. 5b.
3.4. SMC X-1
SMC X-1 is a well-known Roche-lobe-overflow-powered X-ray binary (Papaloizou 1979). It is one of the most powerful X-ray pulsars and is the only X-ray pulsar displaying evidence of steady spin-up (Wojdowski et al. 1998). It also has a super-orbital period of on average ~55 days, which is assumed to be due to the precession of a warped disc (Wojdowski et al. 1998). As seen in the figure, its location is consistent with other Roche lobe overflow systems. Its normalized break frequency is very low at 0.076, implying that it has a large accretion disc.
3.5. OAO 1657-415
OAO 1657-415 has been proven to be neither a Roche-lobe overflow system nor a wind-accreting system although it appears to contain an accretion disc (Baykal 1997, 2000). Torque reversals have also been observed as in the case of Vela X-1, but these have timescales of weeks, in contrast to the short torque reversal period of Vela X-1 (Finger & Prince 1997). The timescale of torque reversal and the inverse break frequency ~66 days are similar. Its normalized break frequency is 0.16, and it should have a large disc. On the other hand, that OAO 1657-415 has a unique place in the Corbet diagram in-between supergiant under-filled Roche Lobe overflow and Be transients suggests that there is a longer living accretion disc relative to the supergiant wind-fed systems.
3.6. SS 433
SS 433 is a black hole binary. It has already been reported to have a break in its X-ray spectral band at ~10-7 Hz by Revnivtsev et al. (2006). Our finding is consistent with their break frequency. It is known to have a Roche-lobe-overflow-powered accretion disc similar to the low mass X-ray binaries (Begelman et al. 2006). Thus, it is expected to be somewhat similar to low mass X-ray binaries with their accretion disc features. That is also confirmed by its position on the plot of the correlation of break frequency to orbital frequency (see Fig. 4). Its normalized break frequency, 0.05, is close to that of SMC X-1, which indicates that they have similar disc properties.
3.7. LMC X-1
LMC X-1 is a persistently luminous X-ray source in the Large Magellanic Cloud. The estimates for the compact star of the binary makes it a good candidate for being a black hole binary. It is also unusual because it is a wind driven system with a steady state disc. The reason why it is considered to be a wind accretor despite having a disc is that the optical counterpart of the compact star fills only 45% of its Roche lobe (Orosz et al. 2009). Since a wind-driven system has a disc of smaller radius than a Roche-lobe-overflow binary, the disc of LMC X-1 is expected to have a shorter viscous timescale than the Roche-lobe overflow systems. However, its normalized break frequency, 0.087, is very low and its location on the fbreak–forb correlation plot is among Roche-lobe-overflow binaries despite being expected to be near the group of Vela X-1. Ruhlen & Smith (2010) claim that LMC X-1 is neither a Roche-lobe-overflow binary nor a wind-accretor, but sits at the boundary. Their reasoning is that the emission and spectral properties of the source do not belong to any specific group. Our result here is consistent with these findings. A more detailed analysis should be performed to account for the unusual behavior of this HMXB.
Figures 5a and b clearly show the distinction between the Roche lobe overflow systems and the wind accreting systems. The normalized disc radii presented in Fig. 5b were determined from Eq. (1). In this equation,  is taken to be the normalized break frequency and
  is calculated as the thickness of standard α-disc
 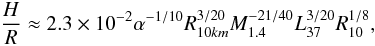 (4)where M1.4 is the mass of the compact object,M1, in units of 1.4 M⊙, i.e. M1 = M1.4 × 1.4 M⊙, R0 = 106R10 km cm is the radius of the compact object, LX = GM1Ṁ/R0 = 1037L37 erg/s is the X-ray luminosity of the source, and Rd = 1010R10 cm is the outer disc radius. Since the derivation of this formula relies on the thin disc approximation, our calculations provide lower limits to the disc sizes. However, the accretion discs of LMXBs show many signs of much thicker accretion discs, eg. by possessing additional coronal flows covering the thin accretion disc etc. The accretion discs of HMXBs should have similar structures that make the disc seem thicker because of the nature of accretion discs. However, we do not expect the irradiation of the disc in high mass X-ray binary systems to be as effective as in those of low mass X-ray binaries; hence, coronal flow would not extend to as large scales as that for H/R ~ 0.1 which the case for LMXBs. Nevertheless, the thickening of the accretion disc would not prevent the Roche-lobe overflow systems and the wind accreting systems being in distinct groups in terms of the low frequency break frequencies in their power density spectra.
4. Summary
We have estimated the power density estimates using the cosine transform of autocorrelation function, a method that can be used for unevenly sampled time series. Using the normalized break frequencies of the sources, we have distinguished two groups of high mass X-ray binaries. Those with lower normalized break frequencies are more likely to have Roche-lobe-overflow accretion discs. These sources are SS 433, OAO 1657-415, SMC X-1, and LMC X-1. On the other hand, Vela X-1, GX 301-2, and 4U 1700-377 have higher normalized break frequencies. These sources are wind accretors. We have discussed the compatibility of the observable properties of the sources and normalized break frequencies. We have deduced that the value of the normalized break frequency is a good estimator for distinguishing
wind accretors from Roche lobe accretors. This method is especially useful for classifying black hole binaries according to their accretion mechanisms, since they cannot be shown on the Corbet diagram where the spin period of the compact object is compared with the orbital period of the system.
Acknowledgments
We would like to thank Marat Gilfanov for useful discussions which helped to improve the paper. We appreciate the useful comments and suggestions of the anonymous referee. We also thank ASTRONS (Astrophysics of Neutron Stars, an FP6 Transfer of Knowledge Project, MTKD-CT-2006-042722) for their support throughout our research. A.B. thanks TUBITAK 1001 project:109T748.
References
- Baykal, A. 1997, A&A, 319, 515 [NASA ADS] [Google Scholar]
- Baykal, A. 2000, MNRAS, 313, 637 [NASA ADS] [CrossRef] [Google Scholar]
- Begelman, M. C., King, A. R., & Pringle, J. E. 2006, MNRAS, 370, 399 [NASA ADS] [CrossRef] [Google Scholar]
- Blondin, J. M. 2000, New A, 5, 53 [NASA ADS] [CrossRef] [Google Scholar]
- Blondin, J. M., & Pope, T. C. 2009, ApJ, 700, 95 [NASA ADS] [CrossRef] [Google Scholar]
- Boynton, P. E., Deeter, J. E., Lamb, F. K., et al. 1984, ApJ, 283, L53 [NASA ADS] [CrossRef] [Google Scholar]
- Chakrabarty, D., Grunsfeld, J. M., Prince, T. A., et al. 1993, ApJ, 403, L33 [NASA ADS] [CrossRef] [Google Scholar]
- Cherepashchuk, A. M., Sunyaev, R. A., Fabrika, S. N., et al. 2005, A&A, 437, 561 [NASA ADS] [CrossRef] [EDP Sciences] [Google Scholar]
- Clark, J. S., Goodwin, S. P., Crowther, P. A., et al. 2002, A&A, 392, 909 [NASA ADS] [CrossRef] [EDP Sciences] [Google Scholar]
- Conti, P. S. 1978, A&A, 63, 225 [NASA ADS] [Google Scholar]
- Deeter, J. E., Boynton, P. E., Lamb, F. K., & Zylstra, G. 1989, ApJ, 336, 376 [NASA ADS] [CrossRef] [Google Scholar]
- Eggleton, P. P. 1983, ApJ, 268, 368 [NASA ADS] [CrossRef] [Google Scholar]
- Finger, M. H., & Prince, T. A. 1997, in Proceedings of the Fourth Compton Symposium, ed. C. D. Dermer, M. S. Strickman, & J. D. Kurfess, AIP Conf. Ser., 410, 57 [Google Scholar]
- Frank, J., King, A., & Raine, D. 2002, Accretion Power in Astrophysics, 3rd edn. (Cambridge University Press) [Google Scholar]
- Gilfanov, M., & Arefiev, V. 2005, unpublished [arXiv:astro-ph/0501215] [Google Scholar]
- Hong, J., & Hailey, C. J. 2004, ApJ, 600, 743 [NASA ADS] [CrossRef] [Google Scholar]
- Jones, C., Forman, W., Tananbaum, H., et al. 1973, ApJ, 181, L43 [NASA ADS] [CrossRef] [Google Scholar]
- Kaper, L., van der Meer, A., & Najarro, F. 2006, A&A, 457, 595 [NASA ADS] [CrossRef] [EDP Sciences] [Google Scholar]
- Koh, D. T., Bildsten, L., Chakrabarty, D., et al. 1997, ApJ, 479, 933 [NASA ADS] [CrossRef] [Google Scholar]
- Lyubarskii, Y. E. 1997, MNRAS, 292, 679 [NASA ADS] [CrossRef] [Google Scholar]
- Miyamoto, S., Kitamoto, S., Iga, S., Negoro, H., & Terada, K. 1992, ApJ, 391, L21 [NASA ADS] [CrossRef] [Google Scholar]
- Orosz, J. A., Steeghs, D., McClintock, J. E., et al. 2009, ApJ, 697, 573 [NASA ADS] [CrossRef] [Google Scholar]
- Paczynski, B. 1977, ApJ, 216, 822 [NASA ADS] [CrossRef] [Google Scholar]
- Papaloizou, J. 1979, MNRAS, 186, 791 [NASA ADS] [Google Scholar]
- Quaintrell, H., Norton, A. J., Ash, T. D. C., et al. 2003, A&A, 401, 313 [NASA ADS] [CrossRef] [EDP Sciences] [Google Scholar]
- Revnivtsev, M., Fabrika, S., Abolmasov, P., et al. 2006, A&A, 447, 545 [NASA ADS] [CrossRef] [EDP Sciences] [Google Scholar]
- Revnivtsev, M., Churazov, E., Postnov, K., & Tsygankov, S. 2009, A&A, 507, 1211 [NASA ADS] [CrossRef] [EDP Sciences] [Google Scholar]
- Ruhlen, L., & Smith, D. M. 2010, BAAS, 41, 672 [NASA ADS] [Google Scholar]
- Sadakane, K., Hirata, R., Jugaku, J., et al. 1985, ApJ, 288, 284 [NASA ADS] [CrossRef] [Google Scholar]
- Sato, N., Nagase, F., Kawai, N., et al. 1986, ApJ, 304, 241 [NASA ADS] [CrossRef] [Google Scholar]
- Shakura, N. I., & Sunyaev, R. A. 1973, A&A, 24, 337 [NASA ADS] [Google Scholar]
- van der Meer, A., Kaper, L., van Kerkwijk, M. H., Heemskerk, M. H. M., & van den Heuvel, E. P. J. 2007, A&A, 473, 523 [NASA ADS] [CrossRef] [EDP Sciences] [Google Scholar]
- Wojdowski, P., Clark, G. W., Levine, A. M., Woo, J. W., & Zhang, S. N. 1998, ApJ, 502, 253 [NASA ADS] [CrossRef] [Google Scholar]
All Tables
All Figures
|
Fig. 1 Long-term light curves of the high-mass X-ray binaries. |
| In the text | |
|
Fig. 2 On the left side, the simulation results of Cen X-3 is presented. The top figure is the power density spectrum in power law with orbital modulation, the middle one is the same as the former but the state transitions are taken into account, and the bottom figure is the real PDS of Cen X-3. On the right side, the simulation results of Vela X-1 is presented. The top figure is the power spectrum only in power law, the middle one is the PDS in power law with orbital modulation, and the bottom figure is the real PDS of Vela X-1. It is clear from the figures that sinusoidal orbital modulation does not affect the trend of the power law, but the state transitions cause an artificial break in the PDS. |
| In the text | |
|
Fig. 3 Power density spectra of high mass X-ray binaries with the best power-law models (the PDS of Vela X-1 is presented in Fig. 2 at the bottom right corner). |
| In the text | |
|
Fig. 4 The relation between the PDS break frequency and the orbital frequency of the binary system. The large shaded area toward the bottom of the plot is the widest region possible for the dependence fvisc vs. forb according to the α-disc, obtained from Eq. (1) in the mass ratio range 2.91 ≤ q ≤ 22.77 for α = 0.5. The dashed lines are predictions for larger values of the disc thickness H/R with α = 0.5 and q values indicated on the plot. Most of the errors in fbreak are on the order of marker (or symbol) size. |
| In the text | |
|
Fig. 5 a) Dependence of the ratio fbreak/forb on the orbital period of the binary system. Some of the errors in fbreak/forb are on the order of the marker (or symbol) size. b) Relation of the normalized outer disc radius to the orbital period of the system. The arrows represent the possible ranges of the outer disc radii (Blondin 2000). |
| In the text | |
Current usage metrics show cumulative count of Article Views (full-text article views including HTML views, PDF and ePub downloads, according to the available data) and Abstracts Views on Vision4Press platform.
Data correspond to usage on the plateform after 2015. The current usage metrics is available 48-96 hours after online publication and is updated daily on week days.
Initial download of the metrics may take a while.