Fig. 4
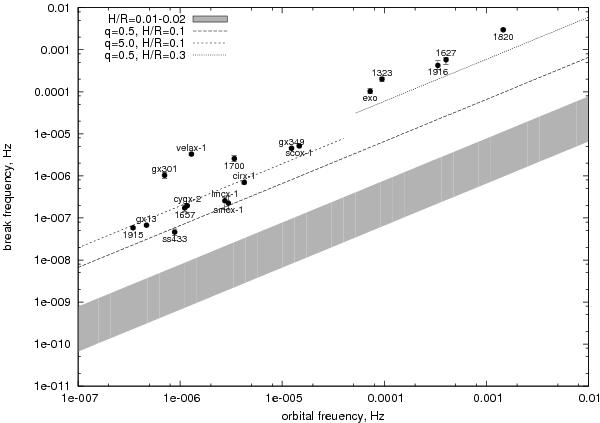
The relation between the PDS break frequency and the orbital frequency of the binary system. The large shaded area toward the bottom of the plot is the widest region possible for the dependence fvisc vs. forb according to the α-disc, obtained from Eq. (1) in the mass ratio range 2.91 ≤ q ≤ 22.77 for α = 0.5. The dashed lines are predictions for larger values of the disc thickness H/R with α = 0.5 and q values indicated on the plot. Most of the errors in fbreak are on the order of marker (or symbol) size.
Current usage metrics show cumulative count of Article Views (full-text article views including HTML views, PDF and ePub downloads, according to the available data) and Abstracts Views on Vision4Press platform.
Data correspond to usage on the plateform after 2015. The current usage metrics is available 48-96 hours after online publication and is updated daily on week days.
Initial download of the metrics may take a while.