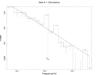
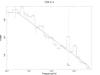
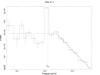
Fig. 2
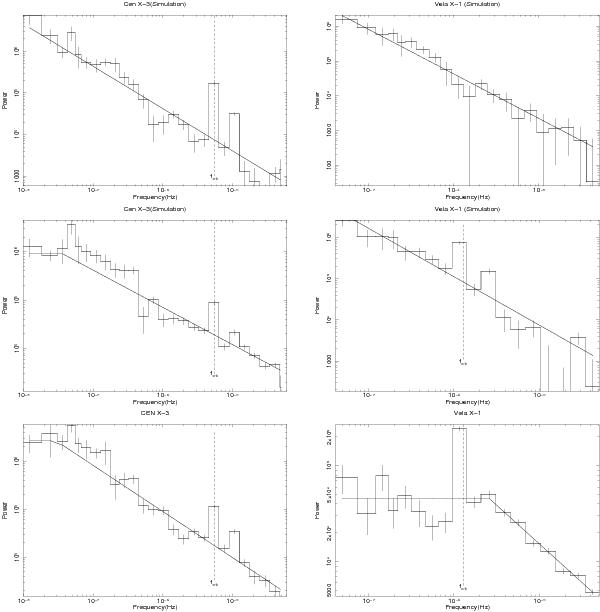
On the left side, the simulation results of Cen X-3 is presented. The top figure is the power density spectrum in power law with orbital modulation, the middle one is the same as the former but the state transitions are taken into account, and the bottom figure is the real PDS of Cen X-3. On the right side, the simulation results of Vela X-1 is presented. The top figure is the power spectrum only in power law, the middle one is the PDS in power law with orbital modulation, and the bottom figure is the real PDS of Vela X-1. It is clear from the figures that sinusoidal orbital modulation does not affect the trend of the power law, but the state transitions cause an artificial break in the PDS.
Current usage metrics show cumulative count of Article Views (full-text article views including HTML views, PDF and ePub downloads, according to the available data) and Abstracts Views on Vision4Press platform.
Data correspond to usage on the plateform after 2015. The current usage metrics is available 48-96 hours after online publication and is updated daily on week days.
Initial download of the metrics may take a while.