| Issue |
A&A
Volume 529, May 2011
|
|
|---|---|---|
| Article Number | A59 | |
| Number of page(s) | 14 | |
| Section | Catalogs and data | |
| DOI | https://doi.org/10.1051/0004-6361/201015528 | |
| Published online | 01 April 2011 | |
High Galactic latitude Fermi sources of γ-rays with energies above 100 GeV
1
ISDC Data Centre for Astrophysics, Ch. d’Ecogia 16, 1290 Versoix, Switzerland
e-mail: This email address is being protected from spambots. You need JavaScript enabled to view it.
2
APC, 10 rue Alice Domon et Léonie Duquet, 75205 Paris Cedex 13, France
e-mail: This email address is being protected from spambots. You need JavaScript enabled to view it.
3
Institute for Nuclear Research RAS, 60th October Anniversary prosp. 7a, Moscow 117312, Russia
Received: 4 August 2010
Accepted: 6 February 2011
Abstract
Aims. We present a catalog of sources of very high energy (E > 100 GeV) γ-rays detected by the Large Area Telescope (LAT) onboard the Fermi Gamma-Ray Space Telescope at Galactic latitudes |b| ≥ 10°.
Methods. We cross-correlate the directions of individual photons with energies above 100 GeV detected by Fermi /LAT with the first year Fermi catalog of sources detected at lower energies. We find a significant correlation between the arrival directions of the highest energy photons and positions of Fermi sources, with the possibility of chance coincidences at the level of 10-45. We present a list of Fermi sources contributing to the correlation signal. A similar analysis is performed to cross-correlate the catalog of BL Lac objects with the highest energy photons detected by Fermi.
Results. We produce a catalog of high Galactic latitude Fermi sources visible at 100 − 300 GeV energies. The catalog is divided into two parts. The first part contains a list of 50 higher significance sources among which there can be three possible false detections. The second part of the catalog contains a list of 25 lower significance sources, among which six are possibly false detections. Finally we identify eight additional sources from the cross-correlation analysis with the BL Lac catalog. The reported sources of E > 100 GeV γ-rays span a broad range of redshifts, up to z ~ 1. Most of the sources are BL Lac type objects. Only 17 out of 83 objects in our list were previously reported as VHE γ-ray sources.
Key words: gamma rays: galaxies / galaxies: active / surveys
© ESO, 2011
1. Introduction
Ground-based Cherenkov γ-ray telescopes HESS, MAGIC, and VERITAS have discovered a population of sources of very high energy (VHE) (E ≥ 100 GeV) γ-rays. Except for the sources discovered in the Galactic plane survey by HESS (Aharonian et al. 2005, 2006), most of the sources were discovered in dedicated pointed observations. Surveys of large regions of the VHE γ-ray sky with the existing Cherenkov telescopes are difficult because of the too-narrow size of the field of view. The wide field-of-view ground-based γ-ray detectors MILAGRO (Atkins et al. 2004) and Tibet (Amenomori et al. 2005) arrays have produced a systematic survey of the VHE γ-ray sky. The energy threshold of the air shower arrays such as MILAGRO and Tibet is rather high (in the multi-TeV band) so that only sources with spectra extending well above 1 TeV could be detected.
All-sky monitoring of γ-ray sources at the energies E ~ 100 GeV became possible with the start of operation of the Large Area Telescope (LAT) onboard the Fermi Gamma-Ray Space Telescope. Compared to the ground-based γ-ray telescopes, the LAT has a much smaller effective area (~1 m2, compared to ~105 m2 for the ground-based γ-ray telescopes). At the same time, at the energies above 100 GeV the Fermi signal is almost background-free (in contrast to the ground based telescopes in which the signal has to be identified on top of the strong background created by cosmic rays and optical/UV night sky background). Neronov et al. (2010) searched for the point sources of E ≥ 100 GeV γ-rays using Fermi data and found eight significant excesses with at least three photons within a 0.1° circle corresponding to the 68% containment radius of the point spread function (PSF) of the LAT. Seven excesses were associated with known VHE γ-ray sources, while the remaining one was identified with the head-tail radio galaxy IC 310. Detection of IC 310 in the VHE band was later confirmed by the MAGIC telescope (Mariotti 2010). Owing to the moderate collection area of Fermi, only the brightest VHE γ-ray sources were detected individually in the Fermi VHE γ-ray sky survey. All other known VHE γ-ray sources at Galactic latitudes |b| ≥ 10° gave ≤ 2 photons within the LAT PSF circle and could not be found from the analysis of the data above 100 GeV alone.
A complementary method for identifying the sources of E ≥ 100 GeV photons detected by Fermi is to use prior knowledge of source positions on the sky and to verify which of the already known sources could have produced the highest energy γ-rays detected by the LAT telescope. In other words, sources of E ≥ 100 GeV γ-rays could be identified also via cross-correlation of arrival directions of the E ≥ 100 GeV γ-rays with the source positions on the sky. This approach to the identification of the sources was previously applied to the analysis of EGRET data above 10 GeV by Dingus & Bretsch (2001) and Gorbunov et al. (2005).
We perform the cross-correlation analysis of the arrival directions of γ-rays with energies above 100 GeV detected by Fermi at Galactic latitudes |b| ≥ 10° with the first year Fermi source catalog (Abdo et al. 2010a). Our analysis results in a catalog of 50 high Galactic latitude sources that correlate with the arrival directions of 100 GeV ≤ E ≤ 300 GeV γ-rays within a 68% containment circle of LAT PSF. Among these 50 sources, seven sources that correlate with ≥ 3 VHE γ-rays (considered previously by Neronov et al. 2010) are detected above 100 GeV with significance ≥ 8σ. Six sources that correlate with two photons are detected with a significance of around 4 − 5σ. Each individual source that correlates with just one VHE γ-ray has a significance of around 3σ in this energy band, the overall significance of the detection of the entire source set being very high. The chance coincidence probability of E > 100 GeV γ-ray arrival directions correlating with the source positions is < 10-40 (excluding the seven high significance sources from Neronov et al. 2010), which corresponds to the significance of detection of the entire set of 50−7 = 43 sources > 13σ. The sources correlating with only one E > 100 GeV photon should be considered as “VHE source candidates”. A simple analysis indicates that most of the sources contributing to the correlation signal are real VHE γ-ray sources, only three of them being expected to be false detections. Taking into account that most of the sources in the list are BL Lac type objects, we extend our cross-correlation analysis to the catalog of BL Lacs (Veron-Cetty & Veron 2010) and find eight more sources that correlate with the arrival directions of 100 GeV ≤ E ≤ 300 GeV γ-rays and are not listed in the first year Fermi catalog. For completeness, we list sources from the first year Fermi catalog for which the E ≥ 100 GeV γ-rays are found within a circle of the radius at which the correlation signal is strongest. Its radius is somewhat larger than the 68% containment circle of LAT PSF. There are 25 such sources, six of them being expected to be false detections because of the chance coincidence of the arrival direction of the VHE γ-ray with the source position. For energies E > 300 GeV, we found correlations with four known sources, one possible new source and one false detection.
The plan of the paper is as follows. In Sect. 2 we discuss data selection and data analysis methods. In Sect. 3, we present the results of the correlation analysis of the arrival directions of E ≥ 100 GeV γ-rays with the sources of the first year Fermi catalog. In Sect. 4, we provide the list of sources contributing to the correlation signal. In Sect. 5 we perform the correlation analysis with the BL Lac catalog of Veron-Cetty & Veron (2010) and give the list of additional BL Lacs correlating with the highest energy Fermi photons, but not present in the first year Fermi catalog. In Sect. 6 we discuss correlations of E ≥ 300 GeV photons with all possible sources discussed above. In Sect. 7 we comment upon individual sources. Finally, in Sect. 8 we discuss the results.
2. Data selection and data analysis
For our analysis, we used the LAT data collected in the period between August 4, 2008 and June 25, 2010. The data were filtered using the gtselect tool provided by Fermi Science Tools1, so that only γ-ray events (evcls=3) with energies above 100 GeV were retained in the analysis. The resulting list of photons has 6376 events. A fraction of the E ≥ 100 GeV photons comes from directions close to the Galactic plane, which is a source of significant diffuse γ-ray emission even at photon energies higher than 100 GeV. Presence of strong diffuse emission complicates the analysis of the point source contribution. Taking this into account, we consider only photons coming from Galactic latitudes |b| ≥ 10°. The cut on the Galactic latitude leaves 4086 photons for the analysis.
For energies E < 300 GeV, photons are thought to be clearly distinguishable from cosmic rays in Fermi, while at E > 300 GeV (evcls=3) the sample contains an unknown number of misidentified cosmic rays (Atwood et al. 2009). We therefore divide data into two energy bins divided at E = 300 GeV. There are 3186 photons with energies 100 GeV ≤ E ≤ 300 GeV, for which we perform our main analysis in the following sections, and there are in addition 900 photons with energies E > 300 GeV, which we discuss separately in Sect. 62.
List of Fermi sources for which a 100 GeV ≤ E ≤ 300 GeV photon is found within the 68% containment circle of radius 0.1°.
The set of photons considered in the analysis includes the list of photons studied by Neronov et al. (2010). In our analysis, we exclude the high-confidence sources of VHE γ-rays identified by Neronov et al. (2010). We also exclude 75 γ-ray photons associated with these eight sources from the Fermi E ≥ 100 GeV photon list, i.e. found within 0.2 degrees of those sources. Otherwise, these sources would dominate the correlation signal. Nevertheless, we include the high-confidence sources in the final source list given in the Table 1, to obtain a complete catalog of sources of VHE γ-rays found by Fermi. The final photon list used in the analysis includes 3111 photons with |b| ≥ 10°.
Photons detected by Fermi/LAT are divided into two types – front- and back-converting. Photons that pair-convert in the top 12 layers of the tracker are classified as front-converting, and are otherwise back-converting (Abdo et al. 2010b). At the same energy, front-converting photons have a somewhat sharper PSF3. We take this into account by considering the sets of 1179 front- and 1934 back- converted photons separately in our correlation analysis.
If the sky region around the source is not too crowded, the point spread functions of individual Fermi sources do not overlap at the energies above ~ 1 GeV. At high Galactic latitudes, the strength and complexity of the diffuse Galactic γ-ray background at energies above 1 GeV is is far lower than the low-latitude/low-energy background. We calculate the spectra of the sources using two methods, one the unbinned likelihood analysis performed using the gtlike tool in narrow energy bins (see http://fermi.gsfc.nasa.gov/ssc/data/analysis/scitools/likelihood_tutorial.html) and the other using the aperture photometry method for the same energy bins. In each case, we verify that the two analysis methods provide consistent results. The aperture photometry method is most useful at the highest energies, at which the photon statistics is low. In this method, we first calculate for each source and each energy the number of source counts within a circle of the radius equal to the 95% containment circle of the LAT PSF and calculate the LAT exposure within this circle using the gtexposure tool. The errors in the measurements are calculated based on a Poisson distribution, which provides the correct description of the data at low photon statistics. To estimate the diffuse sky background at the position of the source, we calculate the number of background counts in a ring with the outer radius 3° and the inner radius equal to the 95% containment radius of the LAT PSF, centered on the source. We verified that the results obtained using such an intuitively simple spectral extraction procedure are consistent with those obtained via spectral extraction using likelihood analysis in narrow energy bins and/or likelihood analysis in the wide energy range using a specific broad-band spectral model.
3. Correlation between arrival directions of E ≥ 100 GeV photons and sources from the first year Fermi catalog
To find sources of E ≥ 100 GeV γ-rays that cannot individually be recognized in the Fermi data in this energy band, we apply a method similar to the one discussed by Dingus & Bretsch (2001) and Gorbunov et al. (2005). Using this method, sources producing just a few photons could be identified. A fraction of identified sources might be false detections because of a chance coincidence of the source position with the arrival direction of a background photon. The fraction of positive-to-false detections could be readily estimated. Real sources should largely outnumber the false source detections. This makes the list of sources contributing to the correlation a valuable “input catalog” for the observations with ground-based γ-ray telescopes that are more sensitive than Fermi in the VHE γ-ray band, but, in contrast to Fermi, do not have all-sky survey capabilities.
As a first choice, we took the first year Fermi catalog as an input catalog for the correlation analysis (Abdo et al. 2010a). The catalog contains 1451 sources, 1043 of which are objects with |b| ≥ 10 degrees. Removing seven confirmed VHE γ-ray sources from the list of Neronov et al. (2010) (IC 310 is not in the Fermi catalog), we obtain an input catalog of Nsource = 1036 sources.
The probability that a γ-ray photon originates within a given distance θ from one source in the catalog is estimated as the ratio of the area of the circle of radius θ to the part of the sky at |b| ≥ 10°![Mathematical equation: \begin{equation} p_1=\frac{\pi\theta^2}{4\pi(1-\cos(80^\circ))}\simeq 9.2 \times10^{-7} \left[\frac{\theta}{0.1^\circ}\right]^2 \cdot \end{equation}](/articles/aa/full_html/2011/05/aa15528-10/aa15528-10-eq124.png) (1)The total probability of a photon originating within an angle θ of one of the catalog sources is then
(1)The total probability of a photon originating within an angle θ of one of the catalog sources is then ![Mathematical equation: \begin{equation} p=N_{\rm source} \cdot p_1 = 9.5 \times 10^{-4} \left[\frac{N_{\rm source}}{1036}\right]\left[\frac{\theta}{0.1^\circ}\right]^2\cdot \end{equation}](/articles/aa/full_html/2011/05/aa15528-10/aa15528-10-eq125.png) (2)The probability that K or more photons from Nγ = 3111 γ-rays come within the angle θ form any of sources in the catalog by chance is given by the binomial probability
(2)The probability that K or more photons from Nγ = 3111 γ-rays come within the angle θ form any of sources in the catalog by chance is given by the binomial probability 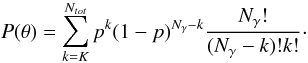 (3)In Fig. 1, we plot this probability as a function of angle θ. The probability that γ-rays with energies higher than 100 GeV come from directions close to the positions of Fermi sources by chance is P < 10-45, i.e. the chance coincidence hypothesis is firmly ruled out.
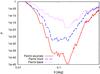 |
Fig. 1 Dependence on the chance probability of correlation between arrival directions of E ≥ 100 GeV photons and positions of Fermi sources as a function of the radius of the search circle. Solid curve corresponds to all photons. Dashed and dotted curves correspond to, respectively, front- and back-converted photons. |
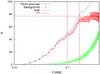 |
Fig. 2 Number of events that come from Fermi sources as a function of the radius of the search circle (red data points). Error bars indicate fluctuations in the background when determining the signal from the sources. Average number of background photons is shown with green line. Vertical line at 0.1 degree is the radius of the 68% containment circle of Fermi PSF. The vertical line at 0.17 degree shows the position of the dip in the probability shown in Fig. 1. The horizontal line indicates the asymptotic number of photons from all the sources. |
The function P(θ) has two minima at around 0.1 degrees and 0.17 degrees. This is explained by how precision with which the arrival direction is determined for the front and back converted γ-rays differs. To verify this, we divide the whole photon list into two parts corresponding to the front and back converted γ-rays and plot the contributions of those photons separately. From Fig. 1, one can see that the minimum at 0.1 degree is due to front photons, while the minimum at 0.17 degrees is due to both front and back photons.
In Fig. 2, we plot the number of source photons with arrival directions within the angle θ from the catalog of Fermi sources and compare it to the expected number of background events within the same distance from the sources. To estimate the number of background events, we used two alternative methods. First, we estimated the expected background near each source counting all photons within 10 degrees from it and estimating the fraction of photons that originate within the angle θ. This method can be used only for θ ≲ 0.5°. For θ ≳ 0.5°, circles around the Fermi sources cover a significant fraction of the sky and overlap. In the second method, we estimated the background by generating 3111 photons in the sky outside the Galactic plane |b| > 10°. We followed the Fermi exposure which had been estimated using the gtexposure tool by keeping Galactic b-values of events and generating randomly l-values. This takes into account the remaining contribution of the Galaxy for |b| > 10°. After that, we average over many Monte Carlo simulations. Both methods gave similar results for small angles.
Vertical lines in Fig. 2 show the angular positions of the two minima of probability seen in Fig. 1. The minima correspond to the places where the steep rise in the number of signal events changes to a plateau. The asymptote of the distribution of signal counts at large θ gives an estimate of the total number of γ-rays contributing to the correlation. One can see that only ~77 out of 3111 events come from known Fermi sources. 48 for these 77 events are displaced by less than 0.1° from the catalog source position. In this circle, one expects only NB, 0.1 ≃ 3 background events. No more than seven background photons are expected at the 95% confidence level and no more than nine background photons are expected at the 99.5% confidence level. The number of events contributing to the correlation within θ = 0.17° circle is NS, 0.17 ≃ 71, while the expected number of background events is NB, 0.17 ≃ 7.7 (13 at the 95% confidence level, 15 at the 99% confidence level).
4. Catalog of extragalactic VHE γ-ray sources
The list of sources contributing to the correlation signal within θ = 0.1° is given in Table 1. There are NSource, 0.1 = 50−7 = 43 sources, if the sources from the list of Neronov et al. (2010) are excluded. For Nγ = 3111, only p·Nγ ≃ 3 photons on average can be at the distance θ ≤ 0.1° from a catalog source by chance. This means that 3 out of 43 new VHE γ-ray sources listed in Table 1 are expected to be false detections (and no more than 7[9] sources are false detections at the 95% [99.5%] confidence level).
It is not possible to know in advance which of the 43 sources from Table 1 are false detections. In principle, the ten sources that have more than one photon within the 95% containment circle of the LAT PSF are not expected to be false detections, because the probability that two background photons come close to one and the same source is much smaller than the same probability for just one background photon. Additional information that might help us to single out the false detections could be obtained by comparing of the estimate of the source fluxes expected from the extrapolation of the measured spectral characteristics of the sources in the 1−100 GeV energy band with the simple estimates of the flux that produces one photon at E ≥ 100 GeV within 1.8 year exposure with Fermi. In principle, a false detection might be spotted if the source contributing to the correlation has low flux and/or a soft spectrum. This is illustrated in Fig. 3 where the distribution of fluxes and photon indices of the AGN from the Fermi AGN catalog (Abdo et al. 2010c) is compared to the distribution of fluxes and photon indices of the sources from Table 1. Dashed lines show the combinations of the spectral parameters that are expected to give a fixed number of photons in the 100 − 300 GeV band, assuming no high-energy cut-off in the spectrum.
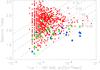 |
Fig. 3 Comparison of the distribution of fluxes and photon indices of Fermi sources of E ≥ 100 GeV γ-rays (triangles) with those of all sources from the Fermi AGN catalog. Blue triangles mark known TeV γ-ray sources. |
Figure 4 shows the measurements of the source fluxes in 0.3−1 GeV, 1−3 GeV, 3−10 GeV, and 10−100 GeV for the entire 1.8 yr Fermi/LAT exposure in addition to the estimates of the source fluxes in the 100−300 GeV band based on the number of E ≥ 100 GeV detected photons from each source.
Although the significance of the detection of individual sources of 1(2) photons in the 100−300 GeV band in Table 1 is around 3σ(4σ), some of the sources are detected with a significance higher than 5σ in the adjacent 30−100 GeV energy band. The 5th and 6th columns of Table 1 show the numbers of photons and the chance coincidence probabilities derived by comparing the expected number of background photons within θ ≤ 0.12° circles (corresponding to the 68% containment circle at 30 GeV) around the sources with the number of source photons in the 30−100 GeV band. For the sources which are detected with more than 5σ significance in the 30−100 GeV band we show more detailed spectra above 1 GeV, calculated using all publicly available data of Fermi collected from August 2008 to June 2010 (rather than the 11 month data used for the analysis of the first year Fermi catalog). One can see that for most of the sources the estimates of the source flux in the 100 − 300 GeV energy bin agree well with the extrapolation of the power-law spectrum from lower energies.
 |
Fig. 4 Comparison of the spectra of the sources from Table 1 in the 1−300 GeV band, obtained with a standard Fermi analysis procedure (red circles represent the flux measurements, red arrows – upper limits), and the estimated source fluxes in the 100 − 300 GeV band, obtained using aperture photometry technique (blue triangles). Aperture photometry data points in the 100 − 300 GeV band are artificially shifted to slightly higher energy to ensure that they are visible, and displayed with the measurements from the likelihood analysis in the same energy band. |
The maximum of the correlation signal (minimum of the chance probability) shown in Fig. 2 is achieved at the angle θ = 0.17°, corresponding to the maximum correlation signal in the back-converted events. The improvement in the correlation achieved with the increase of θ from 0.1° to 0.17° means that there are more real events within the rings 0.1 ≤ θ ≤ 0.17° around their sources, than there are background events in these rings.
Table 2 lists the sources contributing to the correlation signal within θ ≤ 0.17° but not within θ ≤ 0.1°. The number of background events in the ring 0.1° ≤ θ ≤ 0.17° is estimated to be 6. This implies that 6 out of the 25 additional sources listed in Table 2 might be false detections.
List of Fermi sources for which a 100 GeV < E < 300 GeV photon is found within the radius θ = 0.17°, but not within θ = 0.1°.
We note that only 16 out of 75 sources listed in Tables 1 and 2 are already known sources of VHE γ-rays detected by the ground-based γ-ray telescopes. The majority of the sources from Tables 1 and 2 are new real sources in the VHE band. Taking into account that only 9 out of the 75 sources listed in Tables 1 and 2 are possible false detections, the Fermi all sky survey at the energy Eγ ≥ 100 GeV reveals 75−9−16 = 50 new extragalactic VHE γ-ray sources. This doubles the number of already known extragalactic VHE γ-ray sources4.
Another important point is that the E ≥ 100 GeV γ-ray sources listed in Tables 1 and 2 are distributed over a broad range of redshifts. The “record” redshift of the VHE γ-ray source so far was z ≃ 0.5 for the possible detection of 3C 279 during a short several hour flare by MAGIC (Albert et al. 2008). In our Table 1, several sources have redshifts higher than 0.5.
5. Correlation between arrival directions of 100 GeV ≤ E ≤ 300 GeV photons and sources from the 13th Veron catalog
Most of the 100 GeV ≤ E ≤ 300 GeV sources listed in Tables 1 and 2 are BL Lac objects. These sources are known to be characterized by relatively hard spectra in the GeV energy band (Abdo et al. 2010c). It is therefore possible that some of the VHE γ-ray emitting BL Lacs escape detection in the GeV band, while being bright VHE γ-ray sources.
To search for the VHE γ-ray emitting BL Lacs with very hard spectra, we performed a correlation analysis similar to the one reported above for the first year Fermi catalog also for the 13th Veron catalog of BL Lacs (Veron-Cetty & Veron 2010). To select a complete sample of BL Lacs, we adopted the prescription of Gorbunov et al. (2005) and applied a cut to magnitude of objects V < 18.0, which leaves 316 BL Lacs. This set of objects includes six out of seven known VHE γ-ray sources identified in the E ≥ 100 GeV Fermi data by Neronov et al. (2010). As in the analysis of the first year Fermi catalog, we removed those objects and associated photons from analysis. We also removed the three photons associated with IC 310. This leaves Nsource = 310 BL Lac objects and 3111 photons.
The probability that a single photon comes by chance near one of the selected BL Lacs is p = Nsource·p1 = 2.7 × 10⁻⁴·(θ/0.1°)2. The probability that K or more photons fall within an angle θ from one of the sources is calculated using Eq. (3). Figure 5 shows this chance probability as a function of θ. As for the analysis of first year Fermi source catalog, the probability has a minimum at the angular resolution of the LAT at the energies E ≥ 100 GeV. From our correlation analysis we find that 39 BL Lac out of 310 correlate with Fermi data within the angle θ ≲ 0.17° corresponding to the minima of P(θ) from Figs. 1 and 5.
In Fig. 6, we compare the number of source photons to the number of background photons as functions of the angular distance to the BL Lacs. The asymptotic value of the signal events N = 54 is reached at the angular distance ~ 0.2°. At the angle 0.1°, 31 photons come from 28 sources, while only 0.9 of them are on average caused by the background. At 95 % C.L., there are two background photons. At the angular distance 0.17°, 47 photons come from 39 sources, and 2.6 of them correspond to background in average. There are 5[6] background photons at the 95%[99%] confidence level. Eight of these 35 sources are not present in Tables 1 and 2. These seven sources are listed in Table 3. Other sources contributing to the correlation signal in both the first year Fermi and Veron-Cetty & Veron (2010) catalogs are marked by an “V” in Tables 1 and 2.
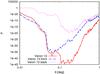 |
Fig. 5 Dependence on the chance probability of correlation between arrival directions of 100 GeV ≤ E ≤ 300 GeV photons and positions of BL Lacs from Veron-Cetty & Veron (2010) catalog as a function of the radius of the search circle. Notations are the same as in Fig. 1. |
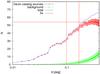 |
Fig. 6 Number of events which come from BL Lac sources as a function of the radius of the search circle. Notations are the same as in Fig. 2. |
We also performed a special analysis with only front photons and a BL Lac catalog. In this case, the correlation signal is maximal at θ ≃ 0.07° (see Fig. 5). At this angle, there are 21 forward photons, which correlate with 20 BL Lac sources. PKS 0301-243 has two photons, which can occur by chance in only P = 10-7 cases. This means that this source is discovered by Fermi. Only 0.18 background photons are expected at this angle, which means that all of the 19 remaining sources are most probably real. At the 99% confidence level, two of the 20 sources might be false detections. Sixteen of these 20 sources are marked as “Vf” in Tables 1 (15 sources) and 2 (1 source) and the remaining six are those have front photons marked “f” in Table 3.
List of BL Lac sources from Veron-Cetty & Veron (2010) catalog for which a 100 GeV ≤ E ≤ 300 GeV photon is found within the circle of radius 0.1° and are not the first year Fermi catalog sources.
6. Sources at energies E > 300 GeV
We discuss correlations between 900 Fermi photons with E > 300 GeV and sources from the first year Fermi catalog and BL Lacs from Veron-Cetty & Veron (2010) catalog. We note that this energy is exactly in the range of sensitivity of the TeV gamma-ray telescopes.
List of Fermi and BL Lac sources from Veron-Cetty & Veron (2010) catalog for which a E > 300 GeV photon is found within the circle of radius 0.17°.
We first consider correlations with sources from the first year Fermi catalog. Using an analysis identical to the one presented in Sect. 3, we study correlations of E > 300 GeV photons with the sources within a θ = 0.1° angular distance. There are four sources correlated within this angle, while only 0.7 photons are expected to be found in the direction of Fermi sources in the case of random coincidences. Those sources are presented in the first four lines of Table 4. All of them are known TeV sources.
We next consider correlations of photons with E > 300 GeV with sources from the first year Fermi catalog within θ = 0.17° in analogy with Table 2. There is one more source (source # 5 in Table 4) that correlates with E > 300 GeV photons within this angle but does not correlate within θ = 0.1°. We expect 2.3 background events within this angle. The E > 300 GeV photons from the direction toward source # 5 is, most probably, a random coincidence, because this source is a blazar at the redshift redshift z > 1. Photons with E > 300 GeV cannot reach the Earth from a source at such high redshift because of the interactions with the infrared background.
We can finally repeat the analysis of Sect. 5 and consider correlations with BL Lacs from Veron-Cetty & Veron (2010) catalog. We find that there are photons correlating with four out of 317 bright BL Lac sources with magnitude V < 18 within θ = 0.1°. Those are sources 2, 3, 4, and 6 in Table 4. In this case, only 0.27 background photons are on average expected. The only new source is source number 6, which is more probably a real source rather than a random coincidence (with probabilities 0.73 vs. 0.27 for the two cases). At the same time, the source is located at a moderate Galactic latitude, 20°, so that the possibility that an excess at the position of the source is due to the diffuse emission from the Galaxy cannot ruled out.
7. Comments on individual sources
7.1. High redshift sources
Several sources in Table 1 have redshifts higher than the redshift of 3C 279, z ≃ 0.5, which is the furtherest known VHE γ-ray source (Albert et al. 2008). The study of high redshift sources in the VHE band is interesting for the measurements of the density and cosmological evolution of the extragalactic background light (EBL) (Gould & Schreder 1967; Kneiske et al. 2004; Stecker et al. 2006; Mazin & Raue 2007; Franceschini et al. 2008) and the cosmological magnetic fields (Neronov & Semikoz 2009; Neronov & Vovk 2010). In this subsection, we provide some details about the high redshift sources from Table 1.
RBS 76 at z = 0.61 has two photons within the distance 0.17° from the catalog source position. It is detected with a of significance more than 4σ in the 100 − 300 GeV band. The source is also detected with a significance of more than 7σ in the 30 − 100 GeV energy band.
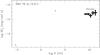 |
Fig. 7 Broad-band spectrum of RBS 76. Grey data points are historical data from NED. |
Broad band spectrum of the source is shown in Fig. 7. The historical multiwavelength data are taken from the NASA Extragalactic Database (NED)5.
PKS 0426-380 at z = 1.11 is a bright source in the GeV energy band, with the flux reaching 10-10 erg/cm2 s. Its γ-ray spectrum is relatively soft and consistent with a power-law with photon index Γ ≥ 2.5. The γ-ray measurements are compared to the multiwavelength data for the source in Fig. 8. As in the case of RBS 76, the overall spectrum of the source could be interpreted in terms of the synchrotron self-Compton or synchrotron external-Compton type models where the radio-to-optical emission is produced by means of the synchrotron mechanism and X-ray-to-γ-ray emission by inverse Compton scattering. The extremely high redshift of the source and possible presence of the high-energy cut-off in the spectrum might increase the difficulty of the source detection with ground-based γ-ray telescopes at energies significantly higher than 100 GeV.
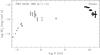 |
Fig. 8 Broad band spectrum of PKS 0426-380. Grey data points show historical data taken from NED. |
SDSS J090513.28+140240.3 at z = 1.12 has a flat (E-2) spectrum in the 1 − 300 GeV band. It was previously only observed in the optical domain. A comparison of γ-ray measurements and historical data is presented in Fig. 9. The extrapolation of the source spectrum from energies below 100 GeV agrees well with the estimated flux in the 100 − 300 GeV band, giving no indication of a cutoff. Despite the low statistics in the data for this band obtained with Fermi/LAT, this means that the source should be observable with ground-based Cherenkov telescopes.
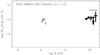 |
Fig. 9 Broad-band spectrum of SDSS J090513.28+140240.3. Grey data points show historical data from NED. |
4C +55.17 at z = 0.8955 also has a relatively soft spectrum in the 1 − 300 GeV band. The γ-ray measurements are compared to the broad-band data in Fig. 10. The source was previously detected in the 0.1 − 1 GeV band by EGRET. There are no other sources from the first year Fermi catalog within a distance 4° of the source. This means that an EGRET measurement most probably refers to the same blazar, rather than to a possible nearby higher flux source. A comparison of the historical EGRET measurement with the Fermi measurement of the source flux shows that the source is variable on a 10 yr timescale.
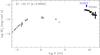 |
Fig. 10 Broad-band spectrum of 4C +55.17. Grey data points show historical data from NED. Blue data point is the measurement of γ-ray flux by EGRET (Thompson et al. 1995). |
PKS B1130+008 at z = 1.223 has the second highest redshift among the sources listed in Table 1. It has an associated front-converted photon with energy 128 GeV. An estimate of the source flux above 100 GeV based on this one photon is above the extrapolation of the source spectrum from the lower energies; we refer to Fig. 11 which possibly indicates that this high redshift source is a false detection. Otherwise, if the source spectrum is flat at energies up to 100 GeV, as indicated by the detection of the E > 100 GeV γ-ray, its observation with the ground-based Cherenkov telescopes should provide valuable constraints on the EBL at redshifts z ~ 1.
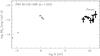 |
Fig. 11 Broad-band spectrum of PKS B1130+008. Grey data points show historical data from NED. |
B3 1307+433 at z = 0.69 has a harder than E-2 spectrum up to the highest energies accessible to Fermi (see Fig. 12). The estimate of the flux based on the detected E > 100 GeV photon agrees well with the extrapolation of the source spectrum from lower energies. This indicates that the source should be readily detectable with ground-based γ-ray telescopes, despite its high redshift.
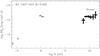 |
Fig. 12 Broad-band spectrum of B3 1307+433. Grey data points indicate historical data from NED. |
PKS 1958-179 at z = 0.65 is also characterized by an excess of high-energy (E > 30 GeV) emission above the extrapolation of the lower energy spectrum with Γ = 2.46 ± 0.07 reported in the first year Fermi catalog. No photons are indeed indeed detected from the source in the energy range 10−30 GeV (see Fig. 13). However, at the energies above 30 GeV the source is clearly identifiable in Fermi count maps (see Fig. 14). Standard likelihood analysis gives TS value TS = 32, which formally corresponds to >5σ detection in this energy range. This indicates that the source spectrum hardens at the energies above 30 GeV. Unfortunately, the statistic of the Fermi signal at the highest energies is insufficient to clarify the nature of the 100 GeV excess in the source spectrum.
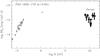 |
Fig. 13 Broad-band spectrum of PKS1958-179. Grey data points show historical data from NED. |
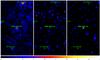 |
Fig. 14 LAT count maps smoothed by 0.3° around the position of PKS 1958-179 in 1 − 10 GeV (left), 10 − 30 GeV (center), and 30 − 300 GeV (right) bands. Color scales are linear, from 0.5 to 5 counts per pixel (left panel), from 0.04 to 0.4 cts/pixel (center), and from 0.03 to 0.3 cts/pixel (right panel). |
BZU J2313+1444 is formally the highest redshift source in Table 1, with z = 1.319. The source is relatively weak. In contrast to the other high-redshift sources, the significance of source detection in the 30 − 100 GeV band is less than 5σ. From Fig. 15, one can see that the source spectrum does not sxhibit a signature of a high energy cut-off. This implies that the source might be an ideal candidate for the study of EBL evolution with redshift.
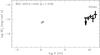 |
Fig. 15 Broad-band spectrum of BZU J2313+1444. Grey data points show data from NED. |
7.2. Sources detected at ≥ 4σ level at E ≥ 100 GeV
Apart from the eight high-confidence sources at E ≥ 100 GeV found by Neronov et al. (2010) and the bright high-redshift sources discussed above, several other sources in Tables 1 and 2 have detection significances higher than 4σ above 100 GeV. We list below these sources and discuss some details of their broad-band spectral energy distribution.
PKS 0301-243 at z = 0.26 has one back- and two front-converted photon associated with the source above 100 GeV. The back photon is within the 95% containment circle of the radius θ = 0.3°. Taken together, the two photons represent a ≃ 5.2σ detection of the source above 100 GeV. At the same time, the source is also detected with high significance in the 30 − 100 GeV band. Both E > 100 GeV photons came during the flaring activity of the source in April-May 2010 (Cannon 2010; Neronov et al. 2010d). The broad-band spectrum of PKS 0301-243, shown in Fig. 16, is consistent with the possibility that radio-to-X-ray emission are produced via the synchrotron mechanism and the 1 − 300 GeV emission via the inverse Compton mechanism.
 |
Fig. 16 Broad-band spectrum of PKS 0301-243. Grey color shows historical data from NED. |
RX J0316.2-2607 is a relatively high redshift (z = 0.443) source, which has two back γ-rays within the distance θ = 0.1°. The chance coincidence probability of finding two photons within this distance from the source is 2.5 × 10⁻⁶, which implies a detection significance 4.7σ above 100 GeV. From Fig. 17, one can see that the source has a hard γ-ray spectrum without a signature of a high-energy cut-off. The γ-ray energy flux from the source is comparable to the optical flux. Similarly to BZU J2313+1444, this source might also be an ideal candidate for the study of both EBL and cosmological magnetic fields.
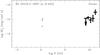 |
Fig. 17 Broad-band spectrum of RX J0316.2-2607. Grey color shows historical data from NED. |
1FGL J0505.9+6121 has three adjacent photons within 0.22°. Formally, the chance probability of finding three photons inside this distance is P = 8 × 10⁻⁸; however, since the detection angle was not defined a priori, it has to be penalized for this and the final probability is just 5σ (see Table 1), still implying that the source is detected at E ≥ 100 GeV individually, and not only within the population of Fermi sources from Table 1. It is also detected with a significance higher than 5σ in the 30 − 100 GeV band. The spectrum of the source shown in Fig. 18 is consistent with a hard power-law (photon index harder than 2) up to the highest energy.
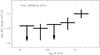 |
Fig. 18 Fermi spectrum of 1FGL J0505.9+6121. |
The object is located near the Galactic plane at b = + 12°, so that it can be of Galactic origin. The high level of Galactic diffuse γ-ray background around the location of the source prevents its detection at lower energies E ≤ 1 GeV. The small value of the test-statistics (TS) value6 for this source in the Table 1 could indicate that this source is not point-like. A standard Fermi/LAT analysis procedure, which was used to calculate the value of TS, does not work in this case.
Detailed multiwavelength observations are needed to constrain its nature. A possible candidate for the source identification is the radio- and X-ray loud AGN RX J0505.9+6113 (Brinkman et al. 1997) situated at the distance 7.6′ from the catalog source position and the distance 0.06° from the front-converted E ≥ 100 GeV photon.
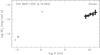 |
Fig. 19 Broad-band spectrum of 1ES 0647+250. Grey color shows historical data from NED. |
1ES 0647+250 at z = 0.201 was already mentioned as a “candidate” TeV blazar in the analysis of Costamante & Ghisellini (2002), based on its broad-band spectra properties. Figure 19 demonstrates that the source has a hard γ-ray spectrum, with no signature of a cut-off up to 300 GeV. This ensures that it should be readily detectable with ground-based γ-ray telescopes.
4C +21.35 at z = 0.432 is an intermediate redshift BL Lac that exhibited a γ-ray flare in April − May 2010 (Donato 2010) during which both E > 100 GeV photons associated with the source were detected, resulting in the detection of the source with 5.6σ significance above 100 GeV (Neronov et al. 2010a). The detection of the source above 100 GeV was recently confirmed with MAGIC observations of the source (Mariotti 2010). A time-averaged spectrum of the source in the 1 − 300 GeV band is shown, together with the historical data, in Fig. 20. The previous EGRET measurement of the source flux is characterized by a somewhat higher source flux. This indicates that the source is variable not only on the short (days to month) timescale, but also on decade-long timescales.
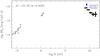 |
Fig. 20 Broad-band spectrum of 4C +21.35. Grey color shows historical data from NED. Blue point is EGRET measurement. |
7.3. Sources from the BL Lac catalog
NPM1G+01.0067 at z = 0.08 was previously detected in the VHE band by HESS (Aharonian et al. 2008). The Fermi spectrum of the source, shown in Fig. 21 is in good agreement with the HESS measurements. In spite of the source not being reported in the first year Fermi catalog, it is detected in the 1.9 yr exposure with a TS value of TS = 108 above 1 GeV.
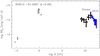 |
Fig. 21 Broad-band spectrum of NPM1G +01.0067. Grey color shows historical data from NED. |
RX J09130-2103 has two γ-rays with energies E ≥ 100 GeV within 0.1° distance. One of the γ-rays is a front-converted γ-ray, for which the 68% containment circle has a smaller radius. The front-converted γ-ray is at the distance 0.01° from the catalog source position and a back photon at 0.03°. The field of the radius 10° around the source contains 20 photons at the energies above 100 GeV. The overall chance probability of finding front- and back-converted photons within the 68% containment circles of the front-converted and back-converted photons is ≃ 10-5.
Despite the source not being reported in the first year Fermi catalog, it is also detected with Fermi at energies below 100 GeV. A standard likelihood analysis in the energy range 1−300 GeV gives the TS value 80, which corresponds to a source detection significance ≃ 9σ.
The map of TS values in the region 2° × 2° around the source is shown in Fig. 23. The TS values were calculated for the model of source distribution in the region 14° around RX J09130-2103 in which all the first year Fermi source catalog sources apart from 1FGL J0908.7-2119 were included and one additional source was allowed to have a variable position. One can see that the TS value at the position of RX J09130-2103 is much larger than that at the position of 1FGL J0908.7-2119, which is only marginally detected above 1 GeV.
The broad-band spectrum of the source is shown in Fig. 22. One can see that the γ-ray spectrum of the source is hard, which explains its non-detection in the first 11 months of operation of Fermi.
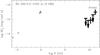 |
Fig. 22 Broad-band spectrum of RX J0913.0-2103. Grey data points show historical data from NED. |
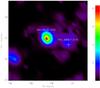 |
Fig. 23 TS map of the region 2° × 2° in the energy band above 1 GeV around the position of RX J0913.0-2103. |
MS 12218+2452 has a front-converted photon at the distance 0.04 from the catalog source position. The source is also not reported in the first year Fermi catalog, but is detected in the 1.5 yr exposure with TS value 80, which corresponds to the ≃ 9σ significance of the source detection.
The map of TS values in the region of size 1° × 1° at energies E ≥ 1 GeV around the source position is shown in Fig. 25. To construct this map, we included all the sources from the first year Fermi catalog situated at the distance θ ≤ 14° from the source position into the model of source distribution on the sky. One can clearly see the source in the TS map.
Fermi data are compared to the broad-band archival data in Fig. 24. The γ-ray flux from the source is comparable to its optical flux intensity. The γ-ray spectrum does not display any signatures of a high-energy cut-off.
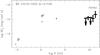 |
Fig. 24 Broad-band spectrum of MS 12218+2452. Grey data points show historical data from NED. |
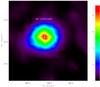 |
Fig. 25 TS map of the region 1° × 1° in the energy band above 1 GeV around the position of MS 12218+2452. |
8. Discussion and conclusions
The study of cross-correlation of the arrival directions of the highest energy photons (E ≥ 100 GeV) detected by Fermi with the catalog of sources detected at lower energies E < 100 GeV has proven to be an efficient way of finding new γ-ray sources observable in the VHE γ-ray band. This study complements the pointed observations of selected γ-ray sources with the ground-based γ-ray telescopes because it results in an all-sky survey of the high Galactic latitude VHE γ-ray sky.
The high Galactic latitude sky survey above 100 GeV has revealed a large number of new VHE γ-ray sources. Adding the list of new sources to that of all sources previously detected with the ground-based γ-ray telescopes doubles the number of known extragalactic VHE γ-ray sources. As for all known VHE γ-ray sources, most of the new sources reported in Tables 1 − 3 are BL Lac type objects, a special type of AGN with jets closely aligned to the line of sight.
The majority of the sources listed in Table 1 are real new VHE γ-ray sources; only three sources are expected to be false detections caused by the chance coincidence of arrival directions of γ-rays with the source position. Several sources in Table 1 have more than one photon associated with them. These sources are detected with high significance in the energy range 100 − 300 GeV. Sources correlating with only one E > 100 GeV photon should be considered as “VHE source candidates”. Apart from the known VHE γ-ray sources, the unidentified Fermi source 1FGL J0505.9+6121 as well as PKS 0301-243 and 4C +21.35 is detected with a significance close to 5σ above 100 GeV. In addition, BL Lacs with an associated front-converted photon, which are found to correlate with the Veron-Cetty & Veron (2010) catalog (marked by “Vf” in Table 1), should also be considered as high-confidence detections.
Table 2 lists 21 lower significance sources, among which five or six are most probably false detections. As for Table 1, the source marked “Vf” (# 56) which contributes with a front-converted photon to the correlation with the BL Lac catalog should be considered as a higher significance detection. For the sources listed in this table, it is reasonable to accumulate longer exposure to single out false detections.
Table 3 lists VHE γ-ray emitting BL Lacs that were not listed in the first year Fermi catalog, but contribute to the correlation of the Fermi VHE γ-rays with the BL Lac catalog of Veron-Cetty & Veron (2010). Their absence from the Fermi catalog might be caused by the hard spectra of these sources. We have demonstrated that three of the eight sources listed in Table 3, the sources # 1, 4, and 7 are, in fact, detected with a significance >5σ in the 1 − 300 GeV band. The other three sources which have a front-converted photon associated with them should also be considered as probable true detections.
Table 4 lists six sources, which have photons with energies above 300 GeV, including four known TeV sources and two possible new sources which are, however, consistent with random coincidences with background photons. Among the TeV sources, only B2 1218+30 does not contain photons in the 100 − 300 GeV energy range within a region θ ≤ 0.2° about its center. However it has 2 back-converted photons at 0.2° < θ < 0.3°.
Some of the new VHE γ-ray sources listed in Table 1 is situated at high redshifts z ~ 1. Our analysis of the γ-ray spectra of the high redshift sources indicates that at least several of them do not display any signatures of a high-energy cut-off up to 300 GeV. The typical fluxes of the sources listed in Tables 1 − 3 are at the level EFE(E ≥ 100 GeV) ≥ (few) × 10-12 erg/(cm2 s), i.e., at the level of 0.1 Crab units. These sources should be readily detectable by ground-based Cherenkov telescopes at energies of several hundreds of GeV. The larger collection area of the ground-based telescopes should result in much higher quality signal statistics, which should allow a study of the detailed spectral properties of these new bright VHE γ-ray sources. We anticipate that a detailed high sensitivity study of high-redshift VHE γ-ray sources with ground-based γ-ray telescopes will enable us to study the cosmological evolution of the BL Lac properties, the EBL, and the associated evolution of galaxies producing the EBL (Gould & Schreder 1967; Kneiske et al. 2004; Stecker et al. 2006; Mazin & Raue 2007; Franceschini et al. 2008), as well as cosmological intergalactic magnetic fields (Neronov & Semikoz 2009; Neronov & Vovk 2010).
For the method discussed below, it does not matter whether the background consists of photons or misidentified cosmic rays. We are grateful to I.Tkachev and P.Tinyakov, who pointed out that we can use photons with E > 300 GeV in our analysis.
http://nedwww.ipac.caltech.edu/
Acknowledgments
We would like to thank Igor Tkachev and Peter Tinyakov, who performed an analysis similar to the one described in Sect. 5 and pointed out to us that we can also use data with E > 300 GeV obtained by Fermi. The work of A.N. and Ie.V. is supported by the Swiss National Science Foundation grant PP00P2_123426.
References
- Abdo, A. A., Ackermann, M., Ajello, M., et al. 2010a, ApJS, 88, 405 [NASA ADS] [CrossRef] [Google Scholar]
- Abdo, A. A., Ackermann, M., Ajello, M., et al. 2010b, ApJ, 720, 435 [Google Scholar]
- Abdo, A. A., Ackermann, M., Ajello, M., et al. 2010c, ApJ, 715, 429 [NASA ADS] [CrossRef] [Google Scholar]
- Aharonian, F. A., Akhperjanian, A. G., Aye, K.-M., et al. 2005, Science, 307, 1938 [NASA ADS] [CrossRef] [PubMed] [Google Scholar]
- Aharonian, F. A., Akhperjanian, A. G., Bazer-Bachi, A. R., et al. 2006, ApJ, 636, 777 [Google Scholar]
- Aharonian, F. A., Akhperjanian, A. G., Barres de Almeida, U., et al. 2008, A&A, 481, L103 [NASA ADS] [CrossRef] [EDP Sciences] [Google Scholar]
- Albert, J., Aliu, E., Anderhub, H., et al. 2008, Science, 320, 1752 [NASA ADS] [CrossRef] [PubMed] [Google Scholar]
- Amenomori, M. 2005, ApJ, 633, 1005 [NASA ADS] [CrossRef] [Google Scholar]
- Atkins, R., Benbow, W., Berley, D., et al. 2004, ApJ, 608, 680 [NASA ADS] [CrossRef] [Google Scholar]
- Atwood, W. B., Abdo, A. A., Ackermann, M., et al. 2009, ApJ, 697, 1071 [NASA ADS] [CrossRef] [Google Scholar]
- Brinkman, W., Siebert, J., Feigelson, E. D., et al. 1997, A&A, 323, 739 [NASA ADS] [Google Scholar]
- Cannon, A. 2010, ATEL, 2591 [Google Scholar]
- Costamante, L., & Ghisellini, G. 2002, A&A, 384, 56 [NASA ADS] [CrossRef] [EDP Sciences] [Google Scholar]
- Dingus, B. L., & Bretsch, D. L. 2001, AIP Conf. Proc., 587, 251 [Google Scholar]
- Donato, D. 2010, ATEL, 2584 [Google Scholar]
- Franceschini, A., Rodighiero, G., & Vaccari, M. 2008, A&A, 487, 837 [NASA ADS] [CrossRef] [EDP Sciences] [Google Scholar]
- Gorbunov, D. S., Tinyakov, P. G., Tkachev, I. I., & Troitsky, S. V. 2005, MNRAS, 362, L30 [NASA ADS] [CrossRef] [Google Scholar]
- Gould, R. J., & Schreder, G. P. 1967, Phys. Rev. Lett., 16, 252 [Google Scholar]
- Kneiske, T. M., Bretz, T., Mannheim, K., & Hartmann, D. H. 2004, A&A, 413, 807 [NASA ADS] [CrossRef] [EDP Sciences] [Google Scholar]
- Mariotti, M. 2010, ATEL, 2510 [Google Scholar]
- Mariotti, M. 2010, ATEL, 2684 [Google Scholar]
- Mazin, D., & Raue, M. 2007, A&A, 471, 439 [NASA ADS] [CrossRef] [EDP Sciences] [Google Scholar]
- Mattox, J. R., Bertsch, D. L., Chiang, J., et al. 1996, ApJ, 461, 396 [NASA ADS] [CrossRef] [Google Scholar]
- Neronov, A., & Semikoz, D. V. 2009, Phys. Rev. D, 80, 123012 [NASA ADS] [CrossRef] [Google Scholar]
- Neronov, A., & Vovk, Ie. 2010, Science, 328, 73 [NASA ADS] [CrossRef] [PubMed] [Google Scholar]
- Neronov, A., Semikoz, D. V., & Vovk, Ie. 2010a, A&A, 519, L6 [Google Scholar]
- Neronov, A., Semikoz, D. V., & Vovk, Ie. 2010b, ATEL, 2617 [Google Scholar]
- Neronov, A. N., Semikoz, D. V., Kachelriess, M., Ostapchenko, S., & Elyiv, A. 2010c, ApJ, 719, L130 [NASA ADS] [CrossRef] [Google Scholar]
- Neronov, A., Semikoz, D. V., & Vovk, Ie. 2010d, ATEL, 2610 [Google Scholar]
- Stecker, F. W., Malkan, M. A., & Scully, S. T. 2006, ApJ, 648, 774 [NASA ADS] [CrossRef] [Google Scholar]
- Thompson, D. J., Bertsch, D. L., Dingus, B. L., et al. 1995, ApJS, 101, 259 [Google Scholar]
- Veron-Cetty, M. P., & Veron, P. 2010, A&A, 518, A10 [NASA ADS] [CrossRef] [EDP Sciences] [Google Scholar]
All Tables
List of Fermi sources for which a 100 GeV ≤ E ≤ 300 GeV photon is found within the 68% containment circle of radius 0.1°.
List of Fermi sources for which a 100 GeV < E < 300 GeV photon is found within the radius θ = 0.17°, but not within θ = 0.1°.
List of BL Lac sources from Veron-Cetty & Veron (2010) catalog for which a 100 GeV ≤ E ≤ 300 GeV photon is found within the circle of radius 0.1° and are not the first year Fermi catalog sources.
List of Fermi and BL Lac sources from Veron-Cetty & Veron (2010) catalog for which a E > 300 GeV photon is found within the circle of radius 0.17°.
All Figures
|
Fig. 1 Dependence on the chance probability of correlation between arrival directions of E ≥ 100 GeV photons and positions of Fermi sources as a function of the radius of the search circle. Solid curve corresponds to all photons. Dashed and dotted curves correspond to, respectively, front- and back-converted photons. |
| In the text | |
|
Fig. 2 Number of events that come from Fermi sources as a function of the radius of the search circle (red data points). Error bars indicate fluctuations in the background when determining the signal from the sources. Average number of background photons is shown with green line. Vertical line at 0.1 degree is the radius of the 68% containment circle of Fermi PSF. The vertical line at 0.17 degree shows the position of the dip in the probability shown in Fig. 1. The horizontal line indicates the asymptotic number of photons from all the sources. |
| In the text | |
|
Fig. 3 Comparison of the distribution of fluxes and photon indices of Fermi sources of E ≥ 100 GeV γ-rays (triangles) with those of all sources from the Fermi AGN catalog. Blue triangles mark known TeV γ-ray sources. |
| In the text | |
|
Fig. 4 Comparison of the spectra of the sources from Table 1 in the 1−300 GeV band, obtained with a standard Fermi analysis procedure (red circles represent the flux measurements, red arrows – upper limits), and the estimated source fluxes in the 100 − 300 GeV band, obtained using aperture photometry technique (blue triangles). Aperture photometry data points in the 100 − 300 GeV band are artificially shifted to slightly higher energy to ensure that they are visible, and displayed with the measurements from the likelihood analysis in the same energy band. |
| In the text | |
|
Fig. 5 Dependence on the chance probability of correlation between arrival directions of 100 GeV ≤ E ≤ 300 GeV photons and positions of BL Lacs from Veron-Cetty & Veron (2010) catalog as a function of the radius of the search circle. Notations are the same as in Fig. 1. |
| In the text | |
|
Fig. 6 Number of events which come from BL Lac sources as a function of the radius of the search circle. Notations are the same as in Fig. 2. |
| In the text | |
|
Fig. 7 Broad-band spectrum of RBS 76. Grey data points are historical data from NED. |
| In the text | |
|
Fig. 8 Broad band spectrum of PKS 0426-380. Grey data points show historical data taken from NED. |
| In the text | |
|
Fig. 9 Broad-band spectrum of SDSS J090513.28+140240.3. Grey data points show historical data from NED. |
| In the text | |
|
Fig. 10 Broad-band spectrum of 4C +55.17. Grey data points show historical data from NED. Blue data point is the measurement of γ-ray flux by EGRET (Thompson et al. 1995). |
| In the text | |
|
Fig. 11 Broad-band spectrum of PKS B1130+008. Grey data points show historical data from NED. |
| In the text | |
|
Fig. 12 Broad-band spectrum of B3 1307+433. Grey data points indicate historical data from NED. |
| In the text | |
|
Fig. 13 Broad-band spectrum of PKS1958-179. Grey data points show historical data from NED. |
| In the text | |
|
Fig. 14 LAT count maps smoothed by 0.3° around the position of PKS 1958-179 in 1 − 10 GeV (left), 10 − 30 GeV (center), and 30 − 300 GeV (right) bands. Color scales are linear, from 0.5 to 5 counts per pixel (left panel), from 0.04 to 0.4 cts/pixel (center), and from 0.03 to 0.3 cts/pixel (right panel). |
| In the text | |
|
Fig. 15 Broad-band spectrum of BZU J2313+1444. Grey data points show data from NED. |
| In the text | |
|
Fig. 16 Broad-band spectrum of PKS 0301-243. Grey color shows historical data from NED. |
| In the text | |
|
Fig. 17 Broad-band spectrum of RX J0316.2-2607. Grey color shows historical data from NED. |
| In the text | |
|
Fig. 18 Fermi spectrum of 1FGL J0505.9+6121. |
| In the text | |
|
Fig. 19 Broad-band spectrum of 1ES 0647+250. Grey color shows historical data from NED. |
| In the text | |
|
Fig. 20 Broad-band spectrum of 4C +21.35. Grey color shows historical data from NED. Blue point is EGRET measurement. |
| In the text | |
|
Fig. 21 Broad-band spectrum of NPM1G +01.0067. Grey color shows historical data from NED. |
| In the text | |
|
Fig. 22 Broad-band spectrum of RX J0913.0-2103. Grey data points show historical data from NED. |
| In the text | |
|
Fig. 23 TS map of the region 2° × 2° in the energy band above 1 GeV around the position of RX J0913.0-2103. |
| In the text | |
|
Fig. 24 Broad-band spectrum of MS 12218+2452. Grey data points show historical data from NED. |
| In the text | |
|
Fig. 25 TS map of the region 1° × 1° in the energy band above 1 GeV around the position of MS 12218+2452. |
| In the text | |
Current usage metrics show cumulative count of Article Views (full-text article views including HTML views, PDF and ePub downloads, according to the available data) and Abstracts Views on Vision4Press platform.
Data correspond to usage on the plateform after 2015. The current usage metrics is available 48-96 hours after online publication and is updated daily on week days.
Initial download of the metrics may take a while.