Fig. 4
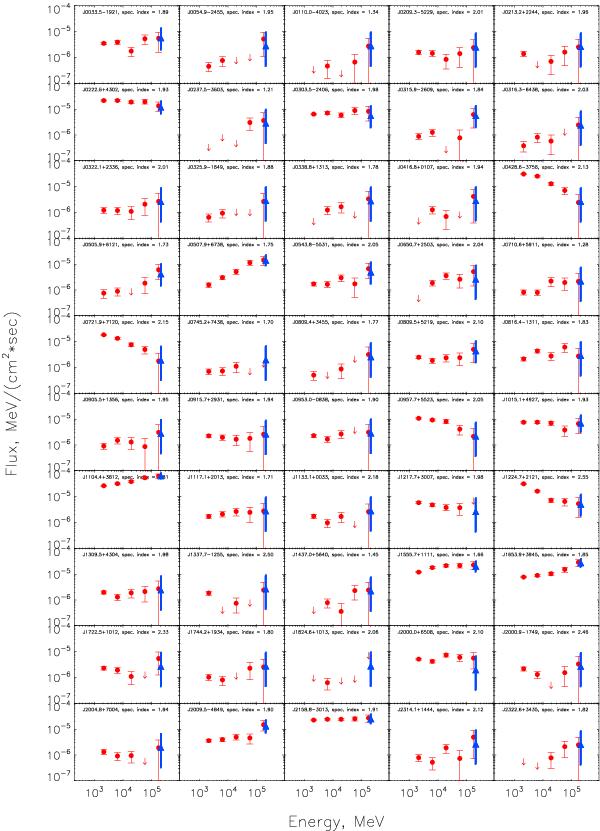
Comparison of the spectra of the sources from Table 1 in the 1−300 GeV band, obtained with a standard Fermi analysis procedure (red circles represent the flux measurements, red arrows – upper limits), and the estimated source fluxes in the 100 − 300 GeV band, obtained using aperture photometry technique (blue triangles). Aperture photometry data points in the 100 − 300 GeV band are artificially shifted to slightly higher energy to ensure that they are visible, and displayed with the measurements from the likelihood analysis in the same energy band.
Current usage metrics show cumulative count of Article Views (full-text article views including HTML views, PDF and ePub downloads, according to the available data) and Abstracts Views on Vision4Press platform.
Data correspond to usage on the plateform after 2015. The current usage metrics is available 48-96 hours after online publication and is updated daily on week days.
Initial download of the metrics may take a while.