Fig. 2
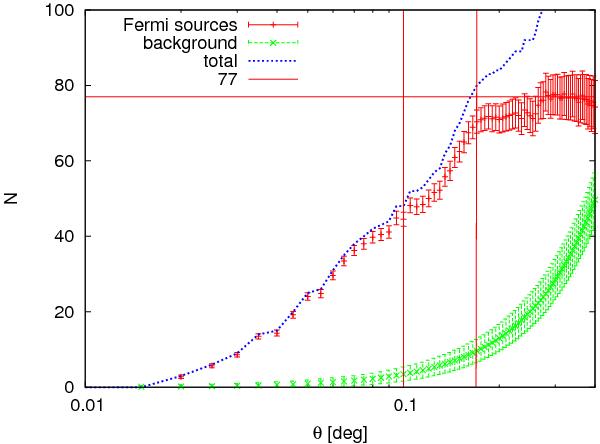
Number of events that come from Fermi sources as a function of the radius of the search circle (red data points). Error bars indicate fluctuations in the background when determining the signal from the sources. Average number of background photons is shown with green line. Vertical line at 0.1 degree is the radius of the 68% containment circle of Fermi PSF. The vertical line at 0.17 degree shows the position of the dip in the probability shown in Fig. 1. The horizontal line indicates the asymptotic number of photons from all the sources.
Current usage metrics show cumulative count of Article Views (full-text article views including HTML views, PDF and ePub downloads, according to the available data) and Abstracts Views on Vision4Press platform.
Data correspond to usage on the plateform after 2015. The current usage metrics is available 48-96 hours after online publication and is updated daily on week days.
Initial download of the metrics may take a while.