Fig. 5
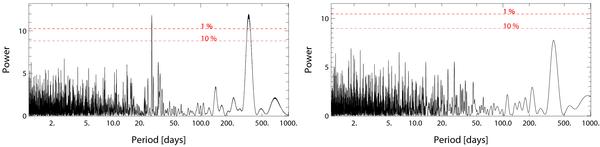
Periodograms of the shift along the equatorial plane assuming a sun five times more active than observed, viewed edge-on and surrounded by a one-Earth-mass planet at 1 AU, and observed once a month approximately, for 50 months. A 0.35 μasrms instrumental noise was added to the data. Left: low-activity period; right: high-activity period.
Current usage metrics show cumulative count of Article Views (full-text article views including HTML views, PDF and ePub downloads, according to the available data) and Abstracts Views on Vision4Press platform.
Data correspond to usage on the plateform after 2015. The current usage metrics is available 48-96 hours after online publication and is updated daily on week days.
Initial download of the metrics may take a while.