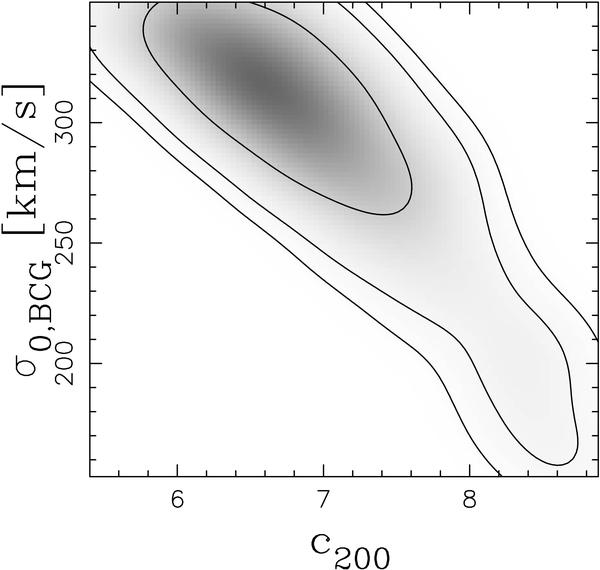
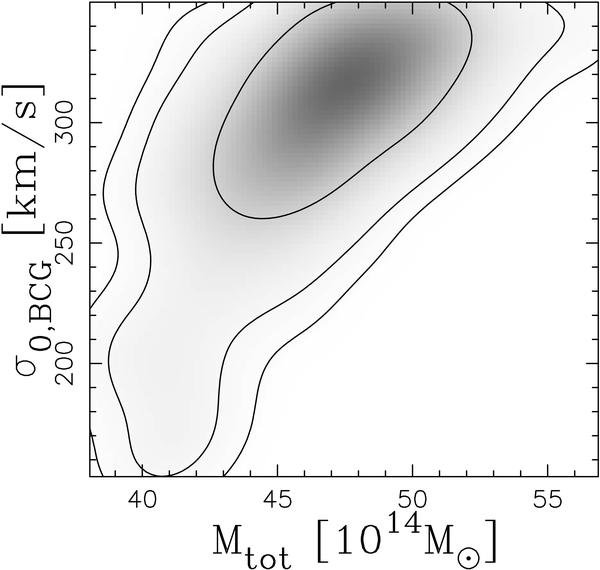
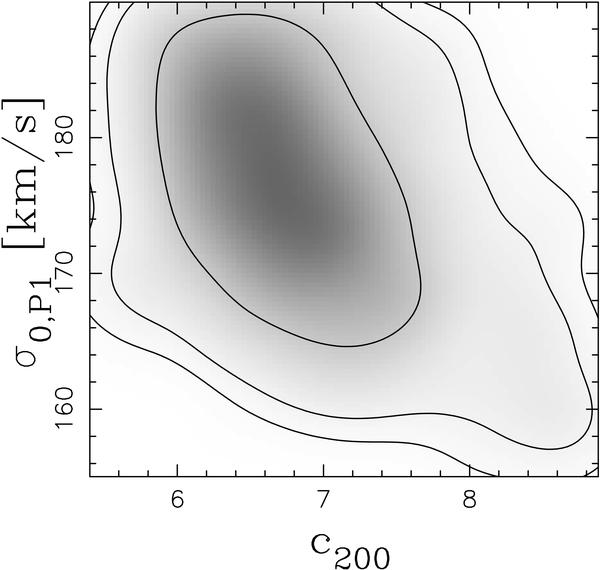
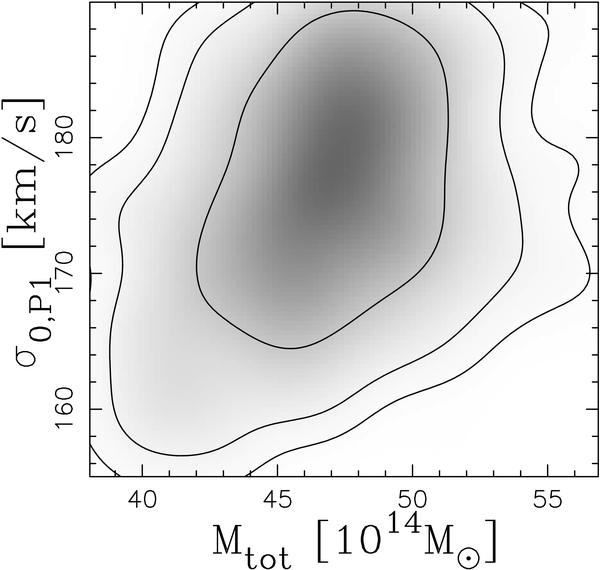
Fig. 9
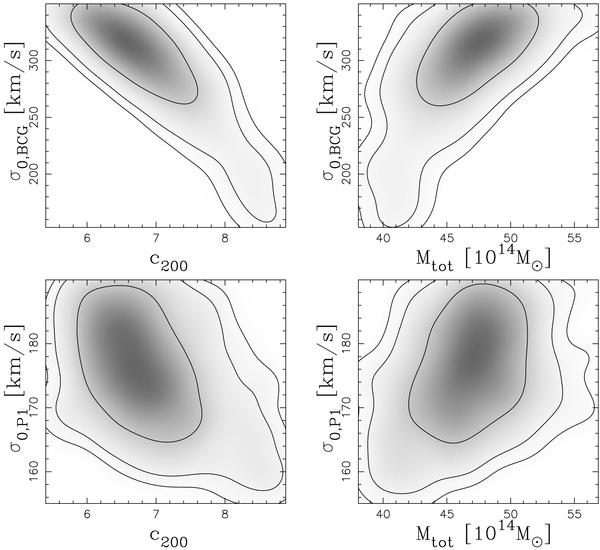
Scatter plots of cluster-halo parameters (c200 and Mtot) versus parameters of the modelling of either the BCG or the perturber galaxy n.1 (hereafter P1, see text for details). Here we show the posterior probability distributions obtained in a representative case (case 1 in Table 5). The plotted parameters are: 1. the NFW concentration parameter c200 versus the BCG fiducial central velocity dispersion σ0,BCG (top left panel); 2. the cluster halo mass Mtot versus σ0,BCGtop right panel); 3. the NFW concentration parameter c200 versus the fiducial central velocity dispersion σ0,P1 of the galaxy P1 (bottom left panel); 4. the cluster halo mass Mtot versus σ0,P1 (bottom right panel). The contours show the 68%, 95% and 99% confidence levels. The colour code refers to the value of the χ2 estimator.
Current usage metrics show cumulative count of Article Views (full-text article views including HTML views, PDF and ePub downloads, according to the available data) and Abstracts Views on Vision4Press platform.
Data correspond to usage on the plateform after 2015. The current usage metrics is available 48-96 hours after online publication and is updated daily on week days.
Initial download of the metrics may take a while.