Fig. 7
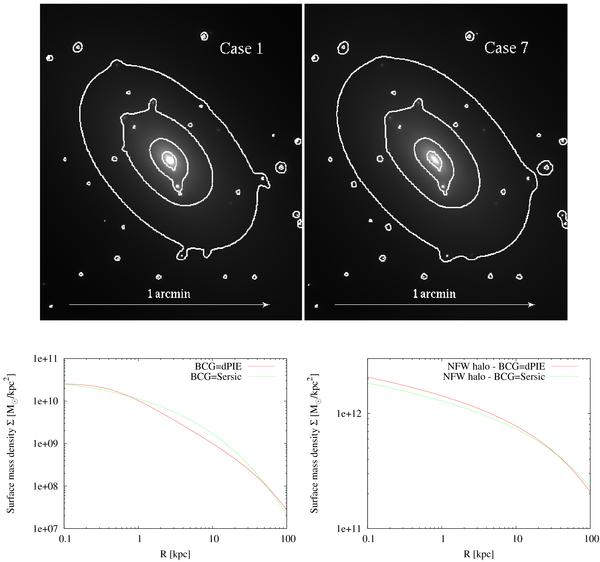
(Top Panels) Comparison between the projected mass maps obtained when modelling the BCG with a dPIE profile (left panel, case 1 in Table 5) or with a Sérsic profile (right panel, case 7 in Table 5). See Table 5 and the text for further details. (Bottom Panels) Comparison between the surface mass density profiles for the BCG halo (left panel) and the NFW cluster scale halo (right panel) derived when modelling the BCG with a dPIE profile (red solid line, case 1) or with a Sérsic profile (green dashed line, case 7).
Current usage metrics show cumulative count of Article Views (full-text article views including HTML views, PDF and ePub downloads, according to the available data) and Abstracts Views on Vision4Press platform.
Data correspond to usage on the plateform after 2015. The current usage metrics is available 48-96 hours after online publication and is updated daily on week days.
Initial download of the metrics may take a while.