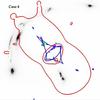
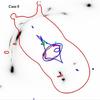
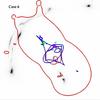
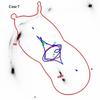
Fig. B.1
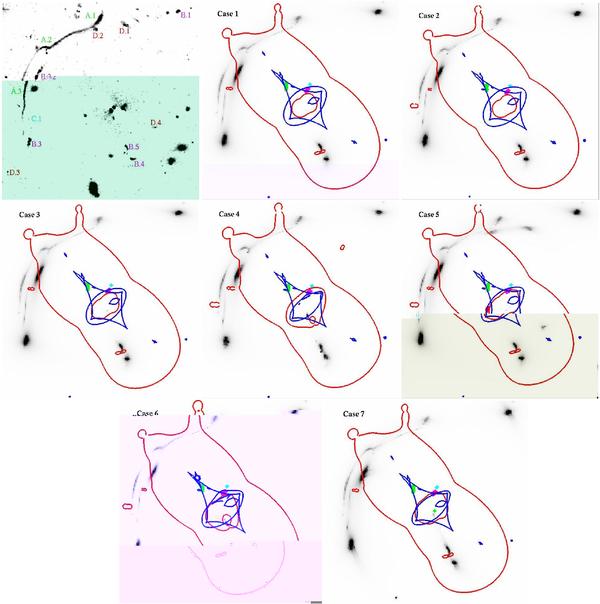
Comparison between the images predicted by our best-fit models and the observed lensed features. (Top left panel) Galaxy-subtracted ACS/HST image of Abell 611. The identified (A,B,C) and candidate (D) lensed systems are marked in green, magenta, cyan, and red. (Top middle, top right, middle and bottom panels) The predicted critical (caustic) lines are overlaid in red (blue) on the images predicted by the best-fit models listed in Table 5. They refer to a source plane at redshift zA = 0.908. The predicted sources are drawn in the last seven panels with the same colour as the corresponding image system in the top left panel. The conjugated knots used as constraints are shown in Fig. 5, whereas their coordinates are listed in Table A.1. The field dimensions of the panels are ≃ [35.2 × 35.1] arcsec; all fields are WCS-aligned. The flux scale is the same in the last seven panels.

Current usage metrics show cumulative count of Article Views (full-text article views including HTML views, PDF and ePub downloads, according to the available data) and Abstracts Views on Vision4Press platform.
Data correspond to usage on the plateform after 2015. The current usage metrics is available 48-96 hours after online publication and is updated daily on week days.
Initial download of the metrics may take a while.