Fig. 13
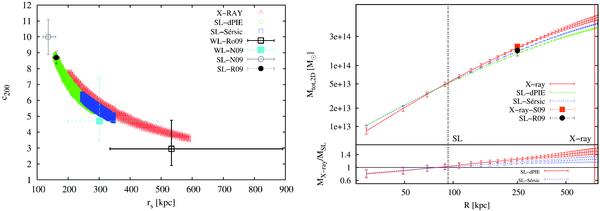
(Left panel) Comparison of the NFW parameter probability distribution obtained with our X-ray and strong lensing analyses. The X-ray and the strong lensing contours show the 3-σ confidence level (the strong lensing results were marginalised over the other fit parameters). The X-ray contours were obtained deriving the X-ray background from the blank-sky data-set, while the strong lensing result refers to case 1 and to case 7 in Table 5. For an easier comparison we overplotted some previous recent results. We show in the plot the results obtained through a strong lensing analysis by Richard et al. (2010) (label SL-R09), through a weak and a strong lensing analysis by Newman et al. (2009) (labels WL-N09 and SL-N09, respectively) and in Paper I through a weak lensing analysis (label WL-Ro09; the results shown here were obtained by adopting a spherical NFW profile; the shear catalogue in this case was derived through the shapelet decomposition technique). The bars show the 1-σ errors. (Top right panel) Projected 2D mass profiles obtained with the X-ray (red solid line) and with the strong lensing analyses when modelling the BCG as a dPIE (green dashed line) or a Sérsic halo (blue dashed line). The vertical lines mark the spatial range of the strong lensing (black dotted line) and X-ray (red solid line) constraints. The X-ray (strong lensing) profile was derived by measuring the enclosed mass in cylinders centred on the X-ray emission centroid [BCG]. The distance between the X-ray centroid and the BCG centre is ≃ 1 ± 1.5 arcsec. The mass map derived from the strong lensing analysis was extrapolated up to a radius of 200 arcsec from the mass measurements obtained in the central regions. The statistical errors on the strong lensing profiles were determined computing the standard deviation from 300 mass map realizations. As a comparison, we report the estimates of the projected total mass within 250 kpc obtained by Richard et al. (2010) through a strong lensing analysis (label SL-R09, marked with a filled black circle) and through an X-ray analysis by Sanderson et al. (2009a) (label X-ray-S09, marked with a filled orange square). (Bottom right panel) Ratios between the X-ray and the strong lensing projected mass estimates; the strong lensing estimates were obtained by modelling the BCG through a dPIE (red solid line) or a Sérsic (blue dotted line) profile.
Current usage metrics show cumulative count of Article Views (full-text article views including HTML views, PDF and ePub downloads, according to the available data) and Abstracts Views on Vision4Press platform.
Data correspond to usage on the plateform after 2015. The current usage metrics is available 48-96 hours after online publication and is updated daily on week days.
Initial download of the metrics may take a while.