Fig. 12
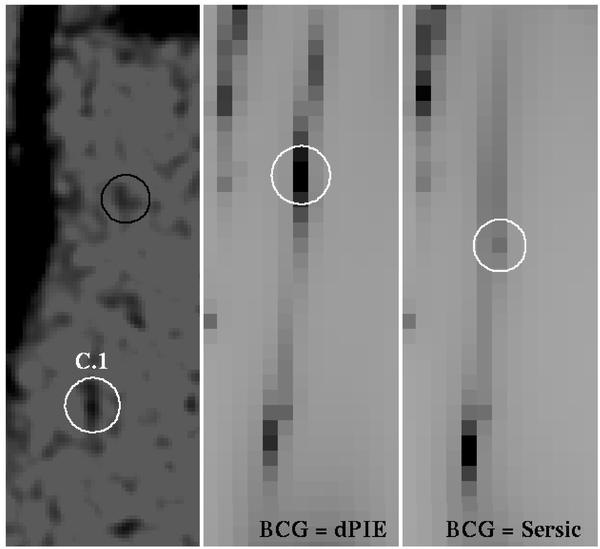
Comparison between the ACS/HST F606W observation (left panel), smoothed with a 3 FWHM pixel Gaussian filter for a better visualisation of the faint lensed image C.1 (marked with a white circle), and the reconstructed image systems predicted from the lens models in case 1 ((middle panel): in this case the BCG was modelled as a dPIE potential) and case 7 ((right panel): the BCG was parametrised with a Sérsic profile – see Table 5). The white circles in the middle and right panels mark the centre of the predicted counter-images. The black circle in the left panel indicates a candidate counter-image of C.1, indentified with SExtractor. The three images are WCS-aligned; the flux scale of the second and the third panel is the same.
Current usage metrics show cumulative count of Article Views (full-text article views including HTML views, PDF and ePub downloads, according to the available data) and Abstracts Views on Vision4Press platform.
Data correspond to usage on the plateform after 2015. The current usage metrics is available 48-96 hours after online publication and is updated daily on week days.
Initial download of the metrics may take a while.