Fig. 10
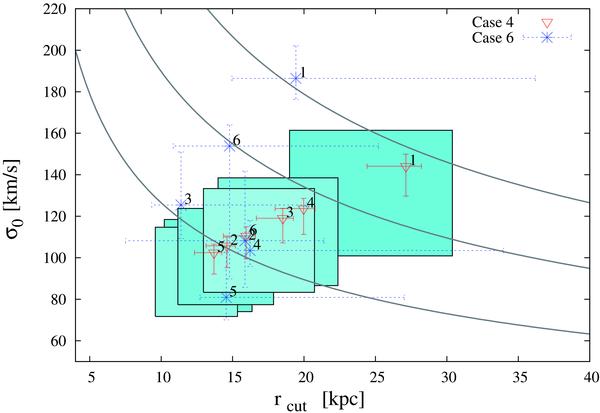
Median values of the dPIE truncation radius rcut vs. the characteristic dPIE central velocity dispersion σ0 for the galaxies that perturb the strong lensing system of Abell 611. The red triangles show the results obtained linking the galaxy parameters to the same scaling relation in the lens modelling (Case 4 in Table 5), while the blue stars represent the results obtained optimising the galaxies individually (Case 6 in Table 5). The grey dashed lines show the iso-density contours. The error bars indicate the 1σ uncertainty, while the cyan boxes indicate the 3σ confidence region for the results which refer to Case 4.
Current usage metrics show cumulative count of Article Views (full-text article views including HTML views, PDF and ePub downloads, according to the available data) and Abstracts Views on Vision4Press platform.
Data correspond to usage on the plateform after 2015. The current usage metrics is available 48-96 hours after online publication and is updated daily on week days.
Initial download of the metrics may take a while.