Fig. 1
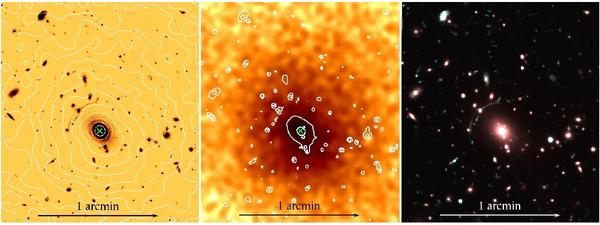
(Left panel) F606W ACS/HST image of the cluster Abell 611 (see Table 3 for the observation summary). The X-ray isophotes derived from the Chandra image (shown in the middle panel) are overlaid in white. The green cross indicates the X-ray centroid. (Middle panel) The Chandra X-ray image of Abell 611 in the energy range [0.25–7.0] keV. The image was smoothed with a 3 pixel FWHM Gaussian filter, and is not exposure-corrected. The contours derived from the HST image (shown in the left panel) are overlaid in white to facilitate the comparison between the images. Here again the green cross marks the X-ray centroid. (Right panel) Pseudo-colour composite image of Abell 611, obtained combining r and g-SLOAN images, taken with the Large Binocular Camera mounted at LBT. The three panels are WCS-aligned; the size of the field of view is ≃ [1.6 × 1.8] arcmin.
Current usage metrics show cumulative count of Article Views (full-text article views including HTML views, PDF and ePub downloads, according to the available data) and Abstracts Views on Vision4Press platform.
Data correspond to usage on the plateform after 2015. The current usage metrics is available 48-96 hours after online publication and is updated daily on week days.
Initial download of the metrics may take a while.