| Issue |
A&A
Volume 527, March 2011
|
|
|---|---|---|
| Article Number | A36 | |
| Number of page(s) | 17 | |
| Section | Extragalactic astronomy | |
| DOI | https://doi.org/10.1051/0004-6361/201015855 | |
| Published online | 21 January 2011 | |
The Submillimeter Array 1.3 mm line survey of Arp 220
1
European Southern Observatory, Alonso de Córdova 3107, Vitacura, Casilla
19001, Santiago 19
Chile
e-mail: smartin@eso.org
2
Institut de Radioastronomie Milimétrique,
300 rue de la Piscine,
38406
Saint Martin d’Heres,
France
3
Centro de Astrobiología (CSIC-INTA), Ctra. de Torrejón Ajalvir, km. 4, 28850
Torrejón de Ardoz, Madrid,
Spain
4
Department of Earth and Space Sciences, Chalmers University of
Technology, Onsala Observatory, 439 92
Onsala,
Sweden
5
Harvard-Smithsonian Center for Astrophysics,
60 Garden Street, Cambridge, MA
02138,
USA
6
Joint ALMA Observatory, Alonso de Córdova 3107, Vitacura, Casilla
19001, Santiago 19, Chile
7
Harvard-Smithsonian Center for Astrophysics, Submillimeter
Array, 645 North A’ohoku
Place, Hilo,
HI
96720,
USA
8
California Institute of Technology, Cahill Center for Astronomy and Astrophysics
301-17, Pasadena,
CA
91125,
USA
9
Dark Cosmology Centre, Niels Bohr Institute, University of
Copenhagen, Juliane Maries Vej
30, DK-2100
Copenhagen Ø,
Denmark
10
Shanghai Astronomical Observatory, Chinese Academy of
Sciences, Shanghai
200030, PR
China
Received:
1
October
2010
Accepted:
9
December
2010
Context. Though Arp 220 is the closest and by far the most studied ULIRG, a discussion is still ongoing on the main power source driving its huge infrared luminosity.
Aims. To study the molecular composition of Arp 220 in order to find chemical fingerprints associated with the main heating mechanisms within its nuclear region.
Methods. We present the first aperture synthesis unbiased spectral line survey toward an extragalactic object. The survey covered the 40 GHz frequency range between 202 and 242 GHz of the 1.3 mm atmospheric window.
Results. We find that 80% of the observed band shows molecular emission,
with 73 features identified from 15 molecular species and 6 isotopologues. The
13C isotopic substitutions of HC3N and transitions from
H O, 29SiO, and CH2CO
are detected for the first time outside the Galaxy. No hydrogen recombination lines have
been detected in the 40 GHz window covered. The emission feature at the transition
frequency of H31α line is identified to be an HC3N molecular
line, challenging the previous detections reported at this frequency. Within the broad
observed band, we estimate that 28% of the total measured flux is due to the molecular
line contribution, with CO only contributing 9% to the overall flux. We present maps of
the CO emission at a resolution of 2.9′′ × 1.9′′ which, though not enough to resolve the
two nuclei, recover all the single-dish flux. The 40 GHz spectral scan has been modelled
assuming LTE conditions and abundances are derived for all identified species.
O, 29SiO, and CH2CO
are detected for the first time outside the Galaxy. No hydrogen recombination lines have
been detected in the 40 GHz window covered. The emission feature at the transition
frequency of H31α line is identified to be an HC3N molecular
line, challenging the previous detections reported at this frequency. Within the broad
observed band, we estimate that 28% of the total measured flux is due to the molecular
line contribution, with CO only contributing 9% to the overall flux. We present maps of
the CO emission at a resolution of 2.9′′ × 1.9′′ which, though not enough to resolve the
two nuclei, recover all the single-dish flux. The 40 GHz spectral scan has been modelled
assuming LTE conditions and abundances are derived for all identified species.
Conclusions. The chemical composition of Arp 220 shows no clear evidence
of an AGN impact on the molecular emission but seems indicative of a purely
starburst-heated ISM. The overabundance of H2S and the low isotopic ratios
observed suggest a chemically enriched environment by consecutive bursts of star
formation, with an ongoing burst at an early evolutionary stage. The large abundance of
water (~10-5), derived from the isotopologue
H O, as well as the vibrationally excited
emission from HC3N and CH3CN are claimed to be evidence of massive
star forming regions within Arp 220. Moreover, the observations put strong constraints on
the compactness of the starburst event in Arp 220. We estimate that such emission would
require ~2−8 × 10⁶ hot cores, similar to those found in the Sgr B2 region
in the Galactic center, concentrated within the central 700 pc of Arp 220.
O, as well as the vibrationally excited
emission from HC3N and CH3CN are claimed to be evidence of massive
star forming regions within Arp 220. Moreover, the observations put strong constraints on
the compactness of the starburst event in Arp 220. We estimate that such emission would
require ~2−8 × 10⁶ hot cores, similar to those found in the Sgr B2 region
in the Galactic center, concentrated within the central 700 pc of Arp 220.
Key words: surveys / galaxies: abundances / galaxies: active / galaxies: individual: Arp 220 / galaxies: ISM / galaxies: starburst
© ESO, 2011
1. Introduction
At a redshift of z = 0.018, Arp 220 is the closest ultraluminous infrared galaxy (ULIRG). This galaxy is an advanced merger system as evidenced by the large tidal tails observed in the optical (Joseph & Wright 1985; Kim et al. 2002; Koda & Subaru Cosmos Team 2009) and the double nuclei (separation ~0.98′′) observed in radio (Norris 1988), mm (Scoville et al. 1997; Downes & Solomon 1998; Sakamoto et al. 1999), sub-mm (Sakamoto et al. 2008) and near-IR wavelenghts (Graham et al. 1990; Scoville et al. 1998). These nuclei are surrounded by two counterrotating gas disks as well as a larger outer disk encompassing both (Sakamoto et al. 1999; Mundell et al. 2001). The main nuclear powering sources in ULIRGs are thought to be starbursts events, active galactic nuclei (AGN), or a combination of both. Mid-IR surveys of ULIRGs with ISO (Genzel et al. 1998) suggested that 70% − 80% of the population are powered by star formation while only 20% − 30% are AGN powered. This result is consistent with that from near-IR searches for hidden broad-line regions (BLRs) towards ULIRGs that lack BLR signatures in the optical (Veilleux et al. 1999).
The identification of the main power source becomes very elusive in extremely obscured nuclei like those of Arp 220. The nuclei in Arp 220 are affected by a severe obscuration at 2.2 μm (Scoville et al. 1998). Even at 1 mm, the dust towards the more massive western nucleus is found to be significantly optically thick (τ ~ 1, Downes & Eckart 2007). Thus, a number of arguments have been proposed in favor of both powering scenarios to explain the large observed IR luminosity of Arp 220, though none of them have been conclusive.
Among the evidence favoring the AGN-powered scenario are studies showing hard X-ray emission strongly concentrated towards the nuclei, a hard spectrum X-ray point source close to the position of the Western nucleus, and a softer point source towards the Eastern nucleus (Clements et al. 2002). Additionally, the luminosity ratio LX(2 − 10 keV)/LFIR is unusually low relative to what is observed in starburst galaxies (Iwasawa et al. 2001, 2005), and the 1.98 keV equivalent width of the 6.7 keV line of Fe is too large to be purely starburst-driven (Teng et al. 2009). The high column densities and therefore obscuration could hide a Compton thick AGN (Sakamoto et al. 1999, 2008; Downes & Eckart 2007).
However, the starburst-driven scenario also appears to be supported by a number of observations. The detection of dozens of radio supernovae (RSNe) in both nuclei of Arp 220 is a clear indication of the starburst events in this galaxy (Lonsdale et al. 2006; Parra et al. 2007). The supernova rate of 4 ± 2 yr-1 agrees with the derived star formation rate based on its FIR luminosity ( ~ 300 M⊙ yr-1, Dopita et al. 2005), which implies that the starburst traced by the detected RSNe is able to produce the observed FIR luminosity (Lonsdale et al. 2006). However this conclusion is based on assumptions about the truncation of the Initial Mass Function (IMF) and that all supernova events result in RSNe, which requires a dense and compact starburst environment (Smith et al. 1998). Towards the Eastern nucleus, the agreement between the supernovae and the dust surface density suggests a starburst heated dust (Sakamoto et al. 2008). A comparison of the OH megamaser emission (Lonsdale et al. 1998) with the sub-mm continuum peak suggests that even if the masers might be associated to an AGN, it would not be the main contributor to the dust heating (Sakamoto et al. 2008). Bright water vapor megamaser emission at 183 GHz suggests the presence of ~106 Sgr B2-like hot cores within the central kiloparsec of Arp 220 (Cernicharo et al. 2006b). Extended faint soft X-ray emission is detected beyond the optical boundaries of the galaxy with bright plumes extending 11 kpc, claimed to be the result of the starburst driven superwinds (McDowell et al. 2003).
The dense gas phase of the interstellar medium (ISM) in Arp220 has been targeted by numerous observations of molecular tracers emission in the mm and sub-mm wavelenghts. These observations provided additional constraints on the nature of the power source from a ISM chemical composition point of view. HNC emission has been observed to be overluminous with respect to HCN in Arp 220 (Huettemeister et al. 1995; Cernicharo et al. 2006b; Aalto et al. 2007b). A similar relative enhancement of HNC is only observed in Mrk 231, with a dominant AGN, and NGC 4418, with a putative buried AGN, which supports the high HNC/HCN ratio to be a chemical indicator of an X-ray dissociation region (XDR, Aalto et al. 2007b). The two nuclei of Arp 220 are revealed to show different physical conditions as observed from the high resolution maps of HNC (Aalto et al. 2009). Model calculations attribute the observed H3O+ emission to enhanced X-ray irradiation (van der Tak et al. 2008). In the FIR, however, the lower level absorption lines in the spectrum of Arp 220 match those observed in the diffuse clouds in the envelope of the Sgr B2 molecular cloud complex hosting a massive star forming event (González-Alfonso et al. 2004).
Although the molecular line observations in Arp 220 are still limited to the brighter species, the compilation of molecular transitions by Greve et al. (2009) as well as the detection of complex organic species (Salter et al. 2008) show that this galaxy is one of the brightest molecular emitters outside the Galaxy together with the starbursts galaxies NGC 253 and M 82. This fact turns Arp 220 into a well suited candidate for molecular line surveys.
It is clear that no matter which powering source drives the large IR luminosity in Arp 220, it will certainly have an imprint on the physical properties and chemical composition of the ISM in this galaxy. In this paper we present the first unbiased chemical study in the 1.3 mm spectral band of Arp 220 with the aim of finding additional physicochemical clues on the nature of its hidden power source.
2. Observations and calibration
 |
Fig. 1 Summary of the frequency coverage of the line survey between 202 GHz and 242 GHz. The central frequency of each band is indicated. The pair of lower (LSB) and upper (USB) sidebands in the observations are indicated by shading the same grey scale. The gap between observed bands is 16 MHz but for the two frequencies shown in the center of the graphic (at 212.016 and 231.936 GHz) where the coverage gap width is 96 MHz. |
Observations were carried out with the Submillimeter Array (SMA) in Mauna Kea, Hawaii. A total of 40 GHz of the 1.3 mm spectrum of Arp 220 were covered between the frequencies of 202 and 242 GHz in the rest frame. This range covers the ~ 30% of the 1.3 mm atmospheric window and the upper 71% of the SMA 230 GHz receivers nominal tunning range.
The correlator configuration provided an instantaneous 1.968 GHz bandwidth with a 0.8125 MHz resolution in each sideband. Using both sidebands, with a separation of 10 GHz, yielded 3.936 GHz per frequency setup. To optimize the frequency coverage, adjacent tuning setups were spaced by 1.984 GHz so that the gap between the observed bands was 16 MHz (~21 km s-1) except for the frequencies 212.016 and 231.936 GHz where a gap of 96 MHz (~127 km s-1) was not covered. With the aim of minimizing the telescope time required to complete the survey we spent only half a track per frequency setup so a total of ~8 GHz could be observed per night. In Fig. 1 we show a summary of the frequency tuning setups as well as the frequency coverage.
The phase reference center of the observations was  and
and  with frequencies redshifted to a velocity of
VLSR = 5450 km s-1. Molecular emission towards
Arp 220 is extended over ~2′′ − 4′′ in size as observed in the CO
J = 1 − 0 (Downes & Solomon
1998), J = 2 − 1 (Sakamoto et al.
1999; Downes & Eckart 2007), and
J = 3 − 2 (Sakamoto et al. 2008).
We used either compact or subcompact SMA configurations so that the vast majority of this
emission would lie within the synthesized beam.
with frequencies redshifted to a velocity of
VLSR = 5450 km s-1. Molecular emission towards
Arp 220 is extended over ~2′′ − 4′′ in size as observed in the CO
J = 1 − 0 (Downes & Solomon
1998), J = 2 − 1 (Sakamoto et al.
1999; Downes & Eckart 2007), and
J = 3 − 2 (Sakamoto et al. 2008).
We used either compact or subcompact SMA configurations so that the vast majority of this
emission would lie within the synthesized beam.
Observational details of each frequency setup.
Gain calibration consisted of 4 min observing scans of the quasars J1613+342 or J1504+104 at a distance of 13.6° and 14.9° from Arp 220, respectively, which were sampled every ~ 20 min. The details on the observation of each individual frequency setup are summarized in Table 1 in which the observing date, SMA configuration, number of antennae available, weather conditions, and the calibrators used are given. Table 2 presents some parameters of the resulting clean maps for each observed frequency. We achieved an average rms of 22 mJy/beam on a 6.5 MHz channel width (i.e. 8 averaged original channels) with synthesized beams ranging from the smallest (2.9′′ × 2.2′′) to the largest (10′′ × 6.9′′) resulting from compact and subcompact configurations, respectively.
Data reduction and calibration were performed using the mir-idl package and imaging was carried out using miriad.
Resulting image parameters for each observed frequency.
2.1. Flux calibration and bandpass determination
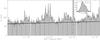 |
Fig. 2 Composite of the 1.3 mm frequency scan carried out with the SMA between 202 and
242 GHz. Each individual spectrum was extracted from the natural weighted datacubes
at the peak of emission position |
Absolute flux density calibration was derived individually for each track from observations of Titan, Uranus or Callisto as indicated in Table 1. The nominal absolute calibration accuracy achieved with the SMA is ~15%. As explained above, observations were carried out so that there were no overlaps among adjacent bands, so the relative flux density calibration becomes more important. To account for variations of the individual flux density calibrations on each of the observed frequency bands we used the flux densities measured for the gain calibrators and fitted their emission dependance with frequency assuming a power law dependance as Sν ∝ να. Given that the observations were all carried out within a short period of time (see Table 1) we can assume the flux density of the quasars not to vary significantly (≲10%). We fitted power laws with α = −1.1 and −1.6 for J1504 + 104 and J1613 + 342, respectively. These power laws are similar to those derived from the upper and lower sidebands on individual observations, which supports the assumption of little daily variation on their flux densities. Corrections based on deviations of the quasar flux densities from the fitted power law were applied to the Arp 220 data. These corrections were smaller than 13% in absolute flux density in all cases. From these corrections we estimate an accuracy in the relative flux density determination of ~6% across the 40 GHz observed band.
Bandpass calibration was derived from long integrations on 3c273, Uranus, or J1924−292. However, the integrations on Callisto and Titan were included in some cases (see Table 1). Titan shows a strong CO line which appears at ~235 GHz and thus it was not used for bandpass in this setup. The accuracy of the bandpass determination was checked on the observed quasars, J1613 + 342 or J1504 + 104, to look for possible bandpass residuals which might mimic line emission. No significant bandpass glitches were found that might affect the analysis presented in this paper. We used this CO line contamination on Titan to check the consistency of the relative flux density calibration based on the assumption of constant flux density of the quasars. We wrongly calibrated the data without masking the channels where CO contributes to the total flux measured in Titan and subsequently applied the correction derived from the power law fitted to J1504 + 104 density fluxes. The resulting corrected flux matched within <5% the calibrated data derived from Titan with the masked CO line.
3. Continuum emission
Due to broad spectral features and the prolific molecular line emission in Arp 220, most of
the observing frequency setups showed little or no line free frequency ranges to be used to
subtract the continuum from individual setups. Thus, continuum emission was not subtracted
in the UV data. Figure 2 shows a composite spectrum of
the whole covered 1.3 mm band. This figure has been composed with the individual spectra
extracted from the peak position of the unresolved emission at
 and .
and .
Table 2 shows the average flux densities measured in
each individual observed ~2 GHz band, where line emission was not subtracted. In order
to estimate and subtract the continuum emission from the spectra we selected a total of 15
narrow frequency bands that we considered as free of molecular emission. The positions of
these bands and the measured continuum flux densities are presented in Table 3. There we also present the measured rms with respect to
the mean flux density and the number of 5.1 MHz channels (~6.4–7.5 km s-1)
averaged for each band. These values are plotted in Fig. 3 where their associated error bars are derived from the measured rms around the
mean flux density value. The total frequency range covered appears to be large enough to
show the changes in the continuum flux as clearly depicted in the Fig. 3. We fitted a power law dependance to the measurements as
Sν ∝ να
with each measurement weighted as  where n is the number of
averaged channels. A power law index of α = 1.3 ± 0.2 (dotted line in
Fig. 3) is derived by fitting all the selected bands
in Table 3. However, we noticed that the flux density
measurements at the two highest frequency continuum bands significantly disagree (>10%)
with the fitted frequency dependance. Such a discrepancy might indicate that the measured
flux densities at the two highest frequencies may be overestimated due to a significant line
contamination or a significant error in the relative flux density calibration. The solid
line in Fig. 3 represents the fit to the data excluding
the values at the highest frequencies, which results in a slope of
α = 1.04 ± 0.02. The difference in flux density between both fits is
<5% for the frequency range covered in our observations, which is within our calibration
accuracy (Sect. 2.1). The continuum flux densities
measured around 212.6, 214.6, and 223.6 GHz also show deviations from both fits, but the
differences from either of the fits are still within <10%. Finally, we adopted the power
law ν1.0 as the frequency dependence for the continuum flux
densities to subtract it from the spectra.
where n is the number of
averaged channels. A power law index of α = 1.3 ± 0.2 (dotted line in
Fig. 3) is derived by fitting all the selected bands
in Table 3. However, we noticed that the flux density
measurements at the two highest frequency continuum bands significantly disagree (>10%)
with the fitted frequency dependance. Such a discrepancy might indicate that the measured
flux densities at the two highest frequencies may be overestimated due to a significant line
contamination or a significant error in the relative flux density calibration. The solid
line in Fig. 3 represents the fit to the data excluding
the values at the highest frequencies, which results in a slope of
α = 1.04 ± 0.02. The difference in flux density between both fits is
<5% for the frequency range covered in our observations, which is within our calibration
accuracy (Sect. 2.1). The continuum flux densities
measured around 212.6, 214.6, and 223.6 GHz also show deviations from both fits, but the
differences from either of the fits are still within <10%. Finally, we adopted the power
law ν1.0 as the frequency dependence for the continuum flux
densities to subtract it from the spectra.
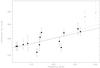 |
Fig. 3 Power law fit to the continuum measurements in molecular emission free bands across the whole 40 GHz surveyed (see Table 3). Fit to all measurements (dotted line) result in a dependance as Sν ∝ ν1.3. The final fit applied to the data (solid line), as derived from the measurements represented by filled squares, shows a power law dependance as Sν ∝ ν1.0. Error bars represent the rms with respect to the average within each selected frequency range. See text in Sect. 3 for details. |
Average continuum fluxes in selected line-free spectral bands.
The average continuum flux in the 1.3 mm band is 142 mJy, ranging from 129 mJy to 154 mJy at 203 and 241 GHz, respectively.
3.1. Line contribution to total emission flux in broad band observations
The data set presented in this work provides an unique opportunity to accurately estimate the contamination of line emission to the continuum flux density measured by broad band detectors at millimeter wavelengths. The average total flux recovered in the 40 GHz spectral band covered by the survey is 195 mJy. As seen in Fig. 2 small subpanel, the molecular line emission at these frequencies is dominated by the J = 2− transition of carbon monoxide. However, the contribution from other molecular species (see Sect. 4) is far from being negligible. Assuming the power law spectrum fitted in the previous section as the continuum level, we assess the total line flux of both CO and other species by integrating the continuum subtracted spectra. We find that the contribution of molecular emission to the overall 40 GHz measured flux constitutes 28%, from which only a 9% of the total flux is attributed to the CO J = 2−1 line. The work by Albrecht et al. (2007) estimated an average contamination by CO to the 1.3 mm flux density of 21.3% based on 1.3 mm bolometer (~50 GHz bandwidth) and CO J = 2−1 observations in a sample of 99 galaxies. Although their sample does not include ULIRGs, where line contribution appears to be very important, the emission of molecules other than CO might be also important in some of their sources. In particular, the line contamination to the continuum flux density might become significant in starbursts, where an also prolific molecular emission is observed (Martín et al. 2006).
Our observations show that at short mm and sub-mm wavelengths, the flux density correction due to molecular line emission is more important than the non-thermal contribution extrapolated from radio measurements (Norris 1988; Scoville et al. 1997). For Arp 220 the non-thermal contribution is estimated to be 7.7 mJy (203 GHz) and 6.7 mJy (241 GHz), equivalent to 6% and 3% of the averaged total flux at those frequencies, respectively, and well below the 28% line contribution.
3.2. Comparison with previous measurements
Scoville et al. (1997) and Sakamoto et al. (1999) reported continuum flux densities of 192 ± 20 mJy and 208 mJy, respectively, in a 1 GHz band centered at 229.4 GHz with the OVRO interferometer. Within the same frequency range we derived an averaged flux density of 185 ± 3 mJy, in good agreement with their measurement. However, at these frequencies, after subtracting the line contribution of ~39 mJy (~21% of the total flux density), the effective continuum flux yields 146 mJy. The continuum flux density would be therefore overstimated by ~30% due to the contamination from line emission.
Woody et al. (1989) measured a flux density of 140 ± 20 mJy at a sky frequency of 219.5 GHz also with the OVRO interferometer. Luckily this 1 GHz band falls into the 223.05 − 224.07 GHz rest frequency band where our survey shows very little line contamination. Our flux density in that range is 146 ± 3 mJy, with just an estimated 2% of line contribution. In this case, the corrected continuum flux density we measure of 142 mJy agrees with that by Woody et al. (1989).
The agreement between the flux density measured in this work and that of Scoville et al. (1997), with a beam ~6.5 times smaller in area, implies that most of the flux density is recovered in both the SMA and OVRO interferometric observations. The discrepancy between the observed flux density by Woody et al. (1989) and the single dish flux density of 340 ± 80 mJy by Thronson et al. (1987) is likely due to strong line contamination in the frequency tuning of the latter (not specified in the publication). Similarly, our observations can easily explain the average single dish flux of 226 ± 10 mJy measured in a broad window centered at 240 GHz (Carico et al. 1992), where molecular line emission such as that of CS J = 5−4 and even the J = 3 − 2 transitions of HCO+ and HCN, among many others, will strongly contribute to the continuum emission.
4. Molecular emission
4.1. Carbon Monoxide
 |
Fig. 4 Robust weighted images of the continuum emission (grey scale) and CO J = 2−1 integrated flux (contours) at a resolution of 2.9′′ × 1.9′′. Continuum emission has been estimated from the 230.904 GHz setup in the ranges not affected by CO or 13CS. The stars represent the position of the 1.3 mm continuum sources from the high resolution images of Sakamoto et al. (1999). Contours are 3σ significant levels of 14 mJy beam-1 and 49 Jy km s-1 for the continuum and line flux, respectively. |
CO J = 2− fitting parameters.
The subpanel in Fig. 2 shows the prominent emission of 12CO J = 2−1 with a peak flux of 2.3 Jy. The overall linewidth derived from fitting a single Gaussian to the line profile is 419.3 ± 1.9 km s-1, in agreement with that measured by Greve et al. (2009) with the JCMT telescope. Within the synthesized beam we measure an integrated flux of ~865 Jy km s-1. Fortunately, near the CO line there are apparently line-free channels within the observed band, and therefore, continuum subtraction could be easily done in the UV-plane. Figure 4 shows the continuum subtracted integrated CO emission overlaid on top of the line-free continuum emission. The total recovered CO flux in the map is 1650 ± 50 Jy km s-1, in good agreement with previous single-dish JCMT measurements (Wiedner et al. 2002; Greve et al. 2009). Thus we recover all the single-dish flux in our maps. This integrated flux is 30% larger than that recovered by the higher angular resolution maps of OVRO (1.2′′ × 1.0′′Scoville et al. 1997) and PdBI (0.7′′ × 0.5′′, Downes & Solomon 1998), due to the missing short-spacing flux in their maps. Figure 5 shows the 50 km s-1 channel maps where CO emission is detected over a 800 km s-1 range, between 4950 and 5750 km s-1.
The spatial resolution of our observations appears not to be enough to disentangle the chemistry of the two nuclei. However, the velocity profile provides us with some rough information about the origin of the molecular emission. Although the broad emission from both nuclei is significantly blended in velocities, as seen in the high resolution maps of CO 1−0 and 2−1 (Scoville et al. 1997; Sakamoto et al. 1999), the lower velocity component is mostly the emission from the southern region and the western nucleus, whereas the higher velocity component mostly traces the emission from the northern region and the eastern nucleus.
We fitted a double Gaussian profile to the spectrum extracted from the emission peak position shown in the inset in Fig. 2. The fitting assumed both velocity components to have equal linewidths. This constraint of double Gaussian profile with an equal linewidth had little impact (<13%) in the relative integrated intensities of each component as compared to an unconstrained fitting. The CO parameters derived from our double Gaussian fit are shown in Table 4 and the fitted profiles are overlaid on top of the CO spectrum in Fig. 2.
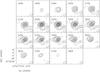 |
Fig. 5 CO J = 2−1 channel maps in steps of 50 km s-1. First 3 contours are 3σ significant and then 6σ up to 100σ, with σ = 19 mJy. The number at top-left in each panel denotes the LSR velocity in km s-1. |
4.2. Line identification
We used the rest frequencies provided by the JPL (Pickett et al. 1998) and CDMS (Müller et al. 2001, 2005) molecular spectroscopy catalogues to identify each spectral feature in the survey. As shown in Fig. 6, a total of 73 individual or groups of molecular transitions were identified in the 40 GHz frequency band covered. Although an average of 1.8 lines/GHz are detected, given the broad emission towards Arp 220 of FWHM ~ 330 MHz, as measured from CO J = 2 − 1, a significant fraction of the observed 1.3 mm band is confusion limited.
A total of 15 molecular species and 6 isotopical substitutions were identified and
fitted. Among them CH2CO is tentatively identified for the first time in the
extragalactic ISM, as well as the isotopologues 29SiO,
HO, and all the 13C substitutions
of HC3N. Table 5 provides an updated
list of all the species identified in the extragalactic interstellar medium. A total of
46 species and 23 isotopical substitution have been identified to date.
Census of extragalactic molecular species and isotopologues detected.
4.3. LTE modelling and fitting of the identified lines
Similar to what is found in Galactic hot cores, the line confusion and blending aggravates direct fitting of Gaussian profiles to individual spectral features. Thus it becomes absolutely necessary to fit synthetic spectra of each identified molecular species to the observed spectrum. Synthetic spectra of each molecule were calculated using the spectroscopic parameters in the JPL and CDMS catalogues (Pickett et al. 1998; Müller et al. 2001, 2005). Assuming local thermodynamic equilibrium (LTE) excitation and optically thin emission we can calculate the integrated intensity of a given transition for any value of column density (N) and excitation temperature (Tex) as described in Appendix B in Martín et al. (2006). Due to both blending and the relatively low signal-to-noise ratio for some species we fitted a double velocity component model with the radial velocity and linewidth fixed to those derived from 12CO in Sect. 4.1. Therefore, only an automatic exploration in the column density and excitation temperature parameters of each velocity component was carried out to fit the model to the observed spectra. The fitting was performed by minimization of the rms of the residuals after subtracting the synthetic spectra from the observations. If the uncertainty due to the constraint of double velocity components with an equal width, discussed for the 12CO line fitting, applies to other molecular lines, an error in the line integrated area of individual components of <13% may be introduced in the synthetic spectral fitting, which is lower than the uncertainty in the absolute flux density and of the same order as the statistical error derived from the Gaussian fit. However, even if the integrated intensity of each individual component can be significantly affected, such fitting constraints are expected to introduce only a small uncertainty of ~1% in the overall integrated area of the whole spectral profile as estimated from the fit to the 12CO line.
As an educated cut-off to the number of lines used to generate the synthetic spectra, we used all the listed transitions with lower level energies El < 1000 cm-1 (~1440 K) in the aforementioned catalogs. Out of the ~3000 transitions used in the model fitting as shown in Fig. 6, only a limited number contribute significantly to the observed spectrum. Table 6 shows the fitted parameters for the subset of 163 molecular transitions with a peak temperature >25 mK, which corresponds to the average 1σ rms noise level at a resolution of ~250 km s-1. These parameters are given for both velocity components centered at 5208 and 5462 km s-1, which we label as component 1 and 2, respectively.
 |
Fig. 6 Detailed view of the spectral line survey. Spectral resolution of the observed data is smoothed to 20.5 MHz (25 − 30 km s-1 across the covered frequency range). The LTE model of the identified molecular species is represented as a thick solid curve. The identified molecular features are labeled. |
Both Fig. 6 and Table 6 are scaled in brightness temperature (Tb).
As detailed by Downes (1989), the conversion factor
from flux density (S) into temperature scale can be calculated as
 (1)where Tmb is the
synthesized main beam brightness temperature and Ωs ⋆ mb is
the solid angle of the convolution between the source size and the beam. Usually, for a
point source we can consider Ωs ⋆ mb ≃ Ωmb. The
K/Jy conversion factors under this approximation are
given in Col. 5 of Table 2. However, in order to
account for the extended emission of Arp 220 we assumed a source size
θs = 2′′, based on the CO J = 2−1 maps by
Scoville et al. (1997). We can therefore correct
for the source beam filling factor to calculate the source brightness temperature as
Tb = Tmb × Ωs ⋆ mb/Ωs
where Ωs is the source solid angle. If we use this in Eq. (1) we obtain
(1)where Tmb is the
synthesized main beam brightness temperature and Ωs ⋆ mb is
the solid angle of the convolution between the source size and the beam. Usually, for a
point source we can consider Ωs ⋆ mb ≃ Ωmb. The
K/Jy conversion factors under this approximation are
given in Col. 5 of Table 2. However, in order to
account for the extended emission of Arp 220 we assumed a source size
θs = 2′′, based on the CO J = 2−1 maps by
Scoville et al. (1997). We can therefore correct
for the source beam filling factor to calculate the source brightness temperature as
Tb = Tmb × Ωs ⋆ mb/Ωs
where Ωs is the source solid angle. If we use this in Eq. (1) we obtain  (2)Column 6 in Table 2 presents this conversion factor at each of the frequencies covered in
this work. We note that this conversion factors assume all molecules coexist and therefore
no variations in the extent of the emission among molecules is considered.
(2)Column 6 in Table 2 presents this conversion factor at each of the frequencies covered in
this work. We note that this conversion factors assume all molecules coexist and therefore
no variations in the extent of the emission among molecules is considered.
Table 8 provides a compilation of the source averaged physical parameters, namely column densities (N) and rotational temperatures (Trot), for each detected species and both velocity components. H2 column density has been derived from the C18O column density assuming a H2/CO ratio of 10-4 and the isotopical 16O/18O abundance ratio of 150, as derived for the starburst NGC 253 (Harrison et al. 1999).
4.3.1. Details on the fitting of individual species
Here we describe the most relevant details on the fitting of particular species.
CH3OH − The main methanol feature in the observed band is the 5−4 group at ~241.8 GHz. This group of transitions together with a number of transitions around 205.7 and 213.4 GHz allow us to derive rotational temperatures of Trot = 15 − 20 K. With this temperature we estimate the contribution of all the transitions present in the band. It is however difficult to assess the presence of high temperature methanol due to the blending of most of its higher transitions.
CH3CCH − With the J = 12 − 11 and J = 13 − 12 groups of transitions of methyl acetylene we derive rotational temperatures of Trot = 16−21 K, similar to those from methanol. With these parameters we have estimated the contribution of the J = 14 − 13 group to the emission of the CH3CN spectral feature at 239 GHz.
SO − Only the 54 − 43 and 55 − 44 transitions at 206.1 and 215.2 GHz are detected unambiguously and not affected by blending to other lines. Both have similar upper energy levels and therefore result in an unreliable measurement of the excitation temperature. The parameters derived from these transitions were applied to estimate the 56 − 45 line emission at 219.9 GHz, observed between the 13CO and C18O lines. The estimated contribution of this transition is not very sensitive to the accuracy of the determined rotational temperature.
CH3CN − together with HC3N, CH3CN is the only species in the survey showing clear evidence of highly excited states. We have detected the emission from CH3CN in both the ground and the v8 = 1 vibrationally excited states. We fitted simultaneously the J = 11−10 and J = 13−12 v8 = 0,1 groups of transitions, as the J = 12−11 is partially blended with 13CO. The derived excitation temperatures are ~400 − 450 K. Although the uncertainty in the excitation temperature is large (20−30%), the high energy vibrational transitions are confirmed in the three observed groups of CH3CN transitions. The estimated intensities of the J = 12 − 11 group agree well with the observed line profile intensities and also show clear contribution of the high excitation transitions. The groups of transitions at 202.8, 221.3, and 239.7 GHz, identified in Fig. 6, are not shown in Table 6, given that these features are due to the contribution of a few dozens of transitions with expected peak intensities at a 0.1σ level.
H2CO − We find only one line of H2CO unblended, namely the 31,2 − 21,1 transition at 225.7 GHz. The 31,3 − 21,2 transition at 211.2 GHz appears to be only partially blended with the faint 34SO and the vibrational HC3N emission. However, these transitions do not have enough dynamic range in their upper energy level to get an accurate determination of the excitation temperature. From the fit to these transitions, the contribution of the H2CO transition at 218 GHz to the HC3N J = 24 − 23 observed line profiles was estimated.
c-C3H2 − Although no accurate temperature can be derived from the multiple transitions of c-C3H2, a better fit to the observed spectrum is obtained with a high excitation temperature of ~100 K. The uncertainty in the column density derived is less than a factor of two compared to that from the fit obtained for a Trot = 20 K.
HC3N − Vibrationally excited emission of HC3N towards Arp 220 has been reported by (Martín-Pintado, in prep). Their detection of HC3N in the v7 = 1 and, tentatively, v6 = 1 vibrational states are confirmed in all the four groups of HC3N transitions covered in this survey. Moreover, we clearly detect the contribution of the emission of HC3N in the v7 = 2 state. In order to avoid an excessive bias towards very high temperatures in the fitting, we used only the pure rotational transition and the v7 = 1, v6 = 1, and v7 = 2 vibrational states. Subsequently, given the high temperatures resulting from the fit, the significant contribution of v4 = 1 and v5 = 1/v7 = 1 lines was calculated from the derived parameters. The fitting to this molecule was performed individually for each group of ro-vibrational transitions, as the model of all the spectral features of HC3N in the survey did not accurately fit the observations. Thus individual measurements of the excitation temperature have been derived for each group. The derived temperatures averaged for both velocity components are ~320, 380, and 440 K for the Jupper = 23, 25, and 26 ro-vibrational groups, respectively. The J = 24−23 group of ro-vibrational transitions are significantly blended with the C18O and H2CO transitions. The excitation temperature was fixed to 355 K as estimated for the Jupper = 24 transition from the temperatures derived from the other groups.
HNCO − No unblended transition of HNCO is detected so no additional information on this species can be derived from this survey. The two brightest HNCO features are blended with C18O and CH3OH. To account for the contribution of HNCO to the model spectra we considered its column density to be a factor of 200 with respect to C18O (Martín et al. 2009a).
Fitted parameters to the identified transitions.
C18O − The J = 2−1 transition of C18O appears in one of the most crowded regions of the whole spectrum. Its emission is blended with transitions of SO, HNCO, CH3OH, and vibrationally excited states of HC3N. We fitted both HNCO and C18O simultaneously, with their column density ratio fixed (200:1, Martín et al. 2009a), to the resulting spectrum after having subtracted the estimated contribution of SO and HC3N.
13CO − The J = 2 − 1 transition of 13CO is partially blended with the CH3CN J = 12 − 11 group of transitions. The transition of 13CO was fitted after subtracting the estimated CH3CN contribution.
 We tentatively identify the spectral
feature at 203.4 GHz as the 31,3 − 22,0 transition of
We tentatively identify the spectral
feature at 203.4 GHz as the 31,3 − 22,0 transition of
 . Details on the certainty of the
identification are given in Sect. 5.2.1. This is
the only species where a single Gaussian fit was performed in order to compare with the
published results from the main isotopologue, H2O (Cernicharo et al. 2006b). Fit results are shown in Table 7.
. Details on the certainty of the
identification are given in Sect. 5.2.1. This is
the only species where a single Gaussian fit was performed in order to compare with the
published results from the main isotopologue, H2O (Cernicharo et al. 2006b). Fit results are shown in Table 7.
H13CC2N − We detected the emission of the three 13C isotopologues of HC3N. Both HC13CCN and HCC13CN emit at the same frequencies, so we assumed both species to have the same abundance. At least one feature of these two isotopologues appears not to be blended to any other identified species. H13CCCN could not be independently fitted due to the blending of the transitions so a similar abundance to the other isotopologues was assumed. For the three isotopologues we used a rotational temperature of 35 K similar to the one derived from the pure rotational transitions of HC3N (see Sect. 5.3).
Water vapor isotopologues detections.
29SiO − The spectral feature at 214.3 GHz is tentatively identified as the 29Si isotopical substitution of SiO. This feature could have a significant contribution from 13CH3CN. The 30SiO transition at 211.8 GHz lies in between two observed frequency setups and therefore we could not identify this transition which was expected to be a factor of 1.5 fainter than that of 29SiO (Penzias 1981).
13CH3CN − The detection of this isotopolgue is unclear and therefore is not indicated in Fig. 6 or in the census presented in Table 5. However, from the two groups of transitions at ~214 and 230 GHz, the latter in the edge of a band, we can estimate an upper limit to its abundance. We used the same rotational temperatures derived from CH3CN for this estimate. The feature at 214.3 GHz cannot be accounted for by the emission of this isotopologue. Moreover, a lower temperature would change the absolute column density derived but does not result in a different contribution to the 214.3 GHz line. This limit supports the identification of 29SiO at this frequency.
CH2CO − The emission of CH2CO could explain part of the spectral feature centered at 224.3 GHz and the residual emission observed not to be fully fitted by CH3CCH at ~222 GHz. We fixed the excitation temperature to 20 K and fitted the rest of lines to get an estimate of the column density. Then the contribution to the 222 and 224.3 GHz features was calculated. The contribution at 222 GHz perfectly reproduces the observed feature, which supports its identification.
4.3.2. Recombination lines
Two hydrogen recombination lines are covered by our data at rest frequencies of 210.5 GHz (H31α) and 231.9 GHz (H30α).
A detection of H31α towards Arp 220 was reported by Anantharamaiah et al. (2000) with a peak flux density of ~60 mJy. The width of their reported transition is much wider than the transitions they observed at radio frequencies. Their single dish line profile agrees well with the line strength and shape of the emission we observe at 210.5 GHz. However, we identify this emission as vibrational transitions of HC3N, which we confirm at other frequencies. Indeed, Anantharamaiah et al. (2000) found their observed H31α line to be an order of magnitude brighter than predicted by their models. Both the line profile and the confirmed emission of vibrationally excited HC3N emission makes it seem that it was not H31α that they detected. Line contamination or misidentifications might also be considered for the other mm transitions they report at 3 mm (H40α and H42α), where they also observed the emission to be much brighter and broader than expected. This is not surprising given that the abundance of molecular transitions reported in this work was not known at the time. Our results yield that the mm recombination lines towards Arp 220 are much fainter that reported, which is in better agreement with the single ionized component model by Anantharamaiah et al. (2000)
H30α lies right in the middle point between two observing setups, in one of the 127 km s-1 gaps in the survey. Should this line be bright enough, given the broad emission of the recombination lines in Arp 220 of ~350 km s-1 (Anantharamaiah et al. 2000), we might expect to detect the edges of the line. However, no signs of emission are observed in any of the neighboring frequencies which implies a non prominent H30α emission as predicted by the the models from Anantharamaiah et al. (2000).
4.3.3. Unidentified features
The LTE approximation appears to be good enough to fit most of the spectral features in the 40 GHz surveyed in this study. However there are a number of features which are not accurately fitted. There are several significant features which are not yet explained such as the residual emission from the CH3CN fit at ~221 GHz or that around CN at ~226 GHz and ~227 GHz. Similarly the emission at ~229.5 GHz is not fitted by the vibrational states of HC3N. Additionally, we observe significant residual emission between C34S and methanol at ~241.5 GHz. All these residual emission features could be due either to contribution from unidentified molecules, or non-LTE emission from the identified species, or a departure from the kinematical constraints on the two Gaussian components applied in the modeling.
On the other hand, there are other unblended features that must be due to unidentified molecular species or transitions under non-LTE conditions. Such is the case of the feature at ~212.1 GHz in the edge of the 213 GHz frequency setup. With a peak intensity of ~150 mK, at a ~7σ level above the rms noise, this is likely an unidentified molecular species. Even more significant is the double 200 mK peak features at 224.0 and 224.4 GHz. The emission from the tentatively detected CH2CO can partially account for this feature but fails to reproduce the broad double-peak emission profile. Finally the broad feature at 234.3 GHz, though tentative, might be from an unidentified line transition although we can not rule out the possibility of a residual in the continuum subtraction.
Exploration of a broader band covering more transitions and deeper integration would be necessary to accurately identify these features.
Derived LTE physical parameters for each velocity component.
5. Discussion
5.1. Chemical composition of Arp 220
The column densities of 18 molecular species and isotopologues other than CO derived from the line survey in this work allow us to carry out a detailed study of chemical composition of the nuclear ISM in Arp 220. In Fig. 7 we compare the derived fractional abundances relative to H2 in Arp 220 with those in the prototypical starburst NGC 253. Molecular hydrogen column densities, as detailed in Sect. 4.3, were derived for both sources from C18O assuming a 16O/18O = 150 as estimated for NGC 253 (Harrison et al. 1999). For Arp 220 we derive NH2 = 1.5 × 1023 cm-2 and 2.5 × 1023 cm-2 for the velocity components 1 and 2, respectively. The direct comparison between the chemical composition of both galaxies show clear overabundances of H2S, HC3N, CH3CN, and CO+ towards Arp 220. Moreover, there is an apparent general overabundance of all the detected molecular species in Arp 220 except for H2CO. By averaging the measured abundances in both galaxies for all species but those mentioned with clear differences in their relative abundances, we notice that the averaged molecular abundances in Arp 220 are a factor of ~4.5 and ~3 higher for the 5208 and 5462 km s-1 velocity components with respect the averaged abundance in NGC 253. Such a difference might be related to the uncertainty in the estimate of the H2 column density from C18O in both galaxies. The 16O/18O ratio is subject to a large uncertainty in NGC 253 (Martín et al. 2010) and is likely to be different in Arp 220. The discrepancy might be even larger if the overproduction of C18O proposed based on CO isotopologues ratios (Matsushita et al. 2009) is confirmed. However, as discussed in Sect. 5.2, this increase would be marked by a significant optical depth in C18O.
In order to avoid the uncertainties derived from the estimate of the H2 column density, we referred the relative abundances of the detected species to that of CS. The CS molecule traces the densest gas component within Arp 220 (n ~ 106 cm-3Greve et al. 2009), which is likely the source of most of the observed chemical complexity. The upper panel in Fig. 8 shows a comparison of the abundances relative to the isotopologue 13CS in both Arp 220 and NGC 253. The lower panel of Fig. 8 shows the ratio between the abundances measured in Arp 220 and those in NGC 253. In the comparison we assume that 13CS is only moderately optically thick (τ < 1) in both galaxies, and that both galaxies have a similar 12C/13C ratio. Additional uncertainties might need to be considered in this comparison if the extent of the emission or the considered excitation conditions vary among the different species. Thus, only abundance differences above a factor of 2 will be considered as relevant between the two sources. Such scatter in the chemical composition are found both in prototypical nearby galaxies and Galactic sources as described in Sects. 4.4.1 and 4.4.2 in Martín et al. (2006), respectively
As mentioned in Sect. 4.1, we cannot spatially resolve the two nuclei. However, we can infer some information from the double Gaussian fit to the line profile, given that both nuclei are somewhat separated in velocity. We find that the abundances in both velocity components, relative to either H2 or 13CS, are the same within a factor of two. But we also find an overabundance of a factor of ~4 in CH3CCH and c-C3H2, and of a factor of ~2.5 in H2S, and HC3N in the lower velocity component, presumably the western nucleus,
We find that, with few exceptions, nearly all molecular species show similar abundances, within a factor of 2, to those in NGC 253. The main differences, shown by both nuclei in Arp 220, are the prominent overabundance of H2S and the underabundance of H2CO in Arp 220 as compared with NGC 253. To a lesser extent, we find the abundances of HC3N (mostly in the velocity component 1) and CO+ (for both velocity components) to be a factor ~3 larger in Arp 220. We also find a marginal underabundance of molecules such as CH3OH and HNCO, being a factor ~2–3 lower towards Arp 220 than in NGC 253. Overall we find that, with a few exceptions, the chemical composition of Arp 220 bears a significant resemblance to that of NGC 253.
 |
Fig. 7 Comparison of the fractional abundances relative to H2 derived for the two velocity components in Arp 220 and those measured in the starburst galaxy NGC 253. Abundances for NGC 253 derived Martín et al. (2006) and H2 derived from C18O (Harrison et al. 1999). |
 |
Fig. 8 (Upper panel) Comparison of the fractional abundances relative to 13CS derived for the two velocity components in Arp 220 and those measured in the starburst galaxy NGC 253. (Lower panel) Ratio of the relative abundances of each velocity component in Arp 220 and in NGC 253. Horizontal dotted lines are set to indicate a ratio of factor of 2 with the aim of guiding the eye in the comparison. Differences below a factor of 2 are not considered representative. |
5.1.1. Sulfur chemistry in Arp 220
The molecular abundance that differs the most in Arp 220 from the starburst galaxy NGC 253 is that of H2S. We observed that all other sulfur bearing molecules in the survey, namely SO, NS, and the isotopologues C34S and 34SO, appear to have relative abundances similar to those in the nuclear region of NGC 253. Our observations show that the average relative abundance ratio is (H2S/13CS)Arp 220 ~ 20 × (H2S/13CS)NGC 253. However this difference strongly depends on the excitation temperature of the species as their abundances have been derived from 2 mm transitions in NGC 253 and 1.3 mm for Arp 220. In order to evaluate whether the observed difference is not due to excitation and actually traces an abundance difference, we calculated the ratios in both galaxies for different excitation temperatures of the gas. Even in the extreme case where the H2S would trace hot gas (Tex > 50 K), the ratio between the relative abundances in both galaxies would drop down to a factor of ~3–5. It shows that regardless of excitation considerations, the relative H2S overabundance in Arp 220 with respect to NGC 253 would still be significant.
Though absolute fractional abundances of the sulfur bearing species strongly depend on the accuracy of the H2 column densities, the relative abundances of these species can be reproduced by the available chemical models (Hatchell et al. 1998). From the comparison to models, the overabundance of H2S can have two possible explanations. The first assumes the grain composition in Arp 220 to be significantly different from that of NGC 253. The H2S frozen in grains, and subsequently injected into gas phase, should be one order of magnitude more abundant. The other possibility is to assume the grain composition to be similar in both objects and consider time dependant sulfur bearing molecules abundances (Hatchell et al. 1998) to be tracing the average age of the star forming molecular clouds. Though it is somewhat speculative to discuss time scales without an accurate measurement of the absolute abundances, we can try to explain the observed differences in the framework of the evolutionary stage of the starburst. In this scenario, the overabundance of H2S would imply the hot cores in Arp 220 are, on average, in an earlier stage of evolution than NGC 253. The comparison of chemical models with observations of a small sample of massive dense cores by Herpin et al. (2009) shows how the CS/H2S abundance ratio decreases by an order of magnitude as a function of the stage of evolution of the clouds. This result would also point out the H2S difference observed between Arp 220 and NGC 253 as a consequence of evolutionary stage of the starburst. From this observational result, the cores in Arp 220, on average, would be in a later stage of evolution than NGC 253, contrary to our previous assertion. However, in that case we would not expect such high H2S abundance as observed in Arp 220. Therefore, the large relative abundance of H2S observed towards Arp 220 appear to favour the idea of an earlier stage of starburst evolution in this galaxy with respect to that in NGC 253. Nevertheless, the abundances of other sulfur-bearing species such as OCS, H2CS and SO2 would be needed for an accurate comparison with the chemical models (Hatchell et al. 1998), similar to that performed with NGC 253 (Martín et al. 2005).
Regarding the possible AGN-driven origin of the enhanced H2S abundance, there is no evidence in the literature to attribute the large abundance of H2S to a possibly hidden AGN. Moreover, recent laboratory experiments show the rapid decline of H2S observed in icy mantles when exposed to ion irradiation (Garozzo et al. 2010).
5.2. Isotopic ratios in Arp 220
In Table 9 we summarize the isotopologue column density ratio derived for each of the species where any isotopic substitution has been measured. Ratios are given for each of the velocity components as well as the average ratio. In the following we will only consider the average ratios, which are less affected by the fitting constraints applied for modelling the observed spectrum.
Isotopic column density ratios.
The large 12CO/13CO ratio
(R12/13 > 20) observed in luminous mergers as compared to
normal starbursts has lead to the postulation of an intrinsic differenciation between the
ISM properties in these objects. An abundance difference can be understood if the ISM in
mergers is fed with unprocessed molecular gas drawn from the external region into their
nuclear region, or the ISM is enriched in 12C by nucleosynthesis in newly
formed massive stars (Casoli et al. 1992).
Additionally, these high ratios can otherwise be explained by different gas surface
densities resulting in differences in opacities between luminous mergers and starbursts
galaxies (Aalto et al. 1995). Towards Arp 220, Casoli et al. (1992) measured a
 ratio of 18 ± 5 based on the
J = 2 − 1 transition, consistent with the limit of
ratio of 18 ± 5 based on the
J = 2 − 1 transition, consistent with the limit of
 and > 22 ratios based on the
J = 1 − 0 lines (Aalto et al.
1991; Casoli et al. 1992). Our results
give a ratio
and > 22 ratios based on the
J = 1 − 0 lines (Aalto et al.
1991; Casoli et al. 1992). Our results
give a ratio  towards Arp 220. However, this is based on
the extracted spectra at the peak of emission, and an estimate of the extended emission is
required to compare with the derived single-dish ratio. As detailed in Sect. 4.1, the overall extended CO emission is about a factor
of 2 larger than that measured towards the central position. To estimate the extended
13CO emission, it would require an accurate continuum measurement and
subtraction as well as precise determination of the emission of the other molecules
contributing to this crowded spectral band. Thus, with the 13CO value at the
central peak of emission and the integrated extended emission of CO we can constrain the
ratio as
towards Arp 220. However, this is based on
the extracted spectra at the peak of emission, and an estimate of the extended emission is
required to compare with the derived single-dish ratio. As detailed in Sect. 4.1, the overall extended CO emission is about a factor
of 2 larger than that measured towards the central position. To estimate the extended
13CO emission, it would require an accurate continuum measurement and
subtraction as well as precise determination of the emission of the other molecules
contributing to this crowded spectral band. Thus, with the 13CO value at the
central peak of emission and the integrated extended emission of CO we can constrain the
ratio as  . These limits assume the extreme
situations of 13CO being as extended as CO or compact, respectively. Though the
upper limit agrees with the average value derived from single dish in the literature of
18 ± 3 (Greve et al. 2009), our limits are
consistent with the range of the
. These limits assume the extreme
situations of 13CO being as extended as CO or compact, respectively. Though the
upper limit agrees with the average value derived from single dish in the literature of
18 ± 3 (Greve et al. 2009), our limits are
consistent with the range of the  ratio found in normal starbursts by Aalto et al. (1995). The 13CO emission from
single dish observations may have been underestimated by both the baseline subtraction
uncertainty due to the limited spectral bandwidth and the unknown contamination by other
species, as well as to a relative calibration issues affecting the single dish data.
ratio found in normal starbursts by Aalto et al. (1995). The 13CO emission from
single dish observations may have been underestimated by both the baseline subtraction
uncertainty due to the limited spectral bandwidth and the unknown contamination by other
species, as well as to a relative calibration issues affecting the single dish data.
The H12C3N/H13C3N ratio is ~7, even lower than that measured with CO. With a critical density of ncrit ~ 2−5 × 106 cm-3, the HC3N emission is likely tracing the densest molecular material in Arp 220. Assuming both CO and HC3N isotopologue ratios are linked to the carbon isotopic ratio, the similar measured ratio would imply equally large opacities affecting the main isotopologues of both species. Thus, no reliable estimates of the 12C/13C isotopic ratio can be derived from these species.
If we assume the SO/34SO ratio of ~3 is less affected by opacity and is representative of the sulfur 32S/34S, it would result in an extremely low sulfur isotopic ratio, significantly lower than the ratios of 8 − 13 measured in the starbursts galaxies NGC 253 and NGC 4945 (Wang et al. 2004; Martín et al. 2005). This low ratio would be consistent with the scenario of 34S overproduction in supernovae (Chin et al. 1996). Indeed, the supernova rate estimated towards Arp 220 of 4 ± 2 yr-1 (Lonsdale et al. 2006) is one or two orders of magnitude higher than the rates of 0.05 − 0.3 yr-1 towards NGC 253 (Ulvestad & Antonucci 1997; Mattila & Meikle 2001). However, if we assume this 32S/34S ratio and the measured average ratio of C34S/13CS ~ 2, we estimate a CS/13CS ratio of ~6, similar to the values derived from both CO and HC3N. Therefore we suspect C34S and SO to be also affected by significant optical thickness effects, resulting in a lower limit to the ratio of SO/34SO > 3.
We measure a 13CO/C18O ratio of ~1, in agreement with the ratio derived with the J = 1 − 0 and J = 2 − 1 transitions (Greve et al. 2009; Matsushita et al. 2009). Even if we assume an optical depth of 13CO of τ13 > 1 (Greve et al. 2009) and 12C/13C isotopic ratio of ~40–50, as measured in starburst galaxies (Henkel et al. 1993; Henkel & Mauersberger 1993), we infer a limit to the ratio of 16O/18O > 80−100. This ratio is lower than that derived towards the starburst NGC 253 (16O/18O > 150, Harrison et al. 1999), which might imply a large opacity affecting 13CO and even a significant opacity affecting C18O as suggested by Matsushita et al. (2009).
Additionally, we have also detected 29SiO at a very low ratio with respect to the main isotopologue. Though the detection remains tentative, we can evaluate the feasibility of this detection as compared with the ratios measured in Galactic sources. Wolff (1980) found 28Si/29Si = 10 ± 3 toward bright SiO emission regions, namely Sgr A and the massive star forming regions Sgr B, Orion A, and W51. They observed this ratio to be a factor of 2 below the terrestrial abundance. Other studies find integrated intensity ratios of 5 − 8 and 12 towards the Giant Molecular Clouds cores W3(H2O) and Sgr B2(M) (Helmich & van Dishoeck 1997; Nummelin et al. 2000), and 10 − 20 towards the late carbon star IRC +1026 (Groesbeck et al. 1994; Kawaguchi et al. 1995). Our detection results in a ratio 28Si/29Si ~ 3 which is only a factor of 2 below the ratio measured towards Orion A (Wolff 1980). Even though this result has to be confirmed at other frequencies and the ratio is subject to a significant error due to the low signal-to-noise of the lines involved, the measured ratio would tentatively point towards a slight 29Si enrichment in Arp 220. However this result is tentative.
As shown for NGC 253 by Martín et al. (2010), an accurate measurement of isotopic ratios towards Arp 220 will require the observation of doubly substituted isotopologues. Our results suggest that the abundances of 34S and 18O isotope could be similar or even higher than those found in local starbursts. A sequence of short and intense starbursts (Parra et al. 2007) or previously enriched gas feeding the starburst might be the reason for such enriched ISM towards Arp 220. However the opacity of the main isotopologues prevents us from further constraining these isotopic ratios.
5.2.1. H O: water vapor isotopologue
emission
O: water vapor isotopologue
emission
The spectral feature observed at 203.4 GHz has been identified as the 18O
isotopologue of the water emission reported by Cernicharo et al. (2006b). Table 7
shows the parameters of the Gaussian profiles fitted to both H2O and
HO. The emission of
para-HO 31,3 − 22,0 has
been detected in a number of Galactic hot cores where the emission is observed to be
significantly blended to the brighter SO2
120,12 − 111,11 emission ~ 16 MHz below
( + 24 km s-1) the HO line (Jacq et al. 1988; Gensheimer et al.
1996). We do not find any trace of significant SO2 emission in the
frequency range covered, where a number of SO2 transition, brighter than that
at 203 GHz, should have been detected. Moreover, if the observed feature would be mostly
dominated by SO2 it would appear red-shifted with respect to the
H2O velocity. However, the rarer isotopologue emission is slightly narrower
and blue-shifted (~ −65 km s-1) with respect to the H2O.
This is consistent with the observed H2O profile (Cernicharo et al. 2006b), which is brighter at the lower velocities.
Also the contribution from methyl formate and dimethyl ether, significant in Galactic
hot cores (Gensheimer et al. 1996), is negligible
in Arp 220 based on the fitting of these species to the whole 40 GHz band.
Unlike nearby starburst galaxies, where no HO observations have been reported, the
detection of HO emission towards Arp 220 is only
possible due to the heavily enriched molecular gas in this galaxy, with very low
16O/18O as suggested in Sect. 5.2. We derive an integrated flux ratio of
 . This ratio is not representative of the
16O/18O isotopic ratio given the weak maser origin of the
H2O line. Moreover, the ratio between both isotopologues might imply that
most of the observed H2O emission in Arp 220 is indeed a weak maser.
. This ratio is not representative of the
16O/18O isotopic ratio given the weak maser origin of the
H2O line. Moreover, the ratio between both isotopologues might imply that
most of the observed H2O emission in Arp 220 is indeed a weak maser.
From the integrated intensity of
~70.5 K km s-1 measured in this work we can estimate a total
column density  assuming optically thin emission and an
excitation temperature of Tex = 100 − 200 K. Given that we
use the C18O emission as a tracer of the total H2 column density,
we can reliably derive the fractional abundance of water of
XH2O = 1.7 × 10⁻⁵, independent of
the assumption on the 16O/18O ratio. This value agrees well with
the fractional abundance observed towards the Sgr B2 region (Cernicharo et al. 2006a) and with an average of
~10-5 towards the 13 hot cores where
was detected in the sample of Gensheimer et al. (1996).
assuming optically thin emission and an
excitation temperature of Tex = 100 − 200 K. Given that we
use the C18O emission as a tracer of the total H2 column density,
we can reliably derive the fractional abundance of water of
XH2O = 1.7 × 10⁻⁵, independent of
the assumption on the 16O/18O ratio. This value agrees well with
the fractional abundance observed towards the Sgr B2 region (Cernicharo et al. 2006a) and with an average of
~10-5 towards the 13 hot cores where
was detected in the sample of Gensheimer et al. (1996).
We observed a luminosity of
3.9 × 10⁷ K km-1 pc2 in the central 2′′
(~700 pc) of Arp 220. The observations of by Gensheimer et al. (1996) towards the Sgr B2 molecular cloud complex shows the
emission to be concentrated towards Sgr B2(N) hot core, with a significantly lower
intensity towards the Sgr B2(M) core. They reported an integrated intensity of
17.4 K km s-1 towards Sgr B2(N). The emission is unresolved at their
12′′ (~0.5 pc) resolution, which is similar to the 0.4 − 0.5 pc size estimated for
the northern core (Lis & Goldsmith 1990).
Assuming a range in the extent of the emission extent of 0.5 − 1 pc and using a similar
argument to that for H2O in Cernicharo et al.
(2006b), a total of ~2−8 × 10⁶ Sgr B2(N)-like cores would be
required and enclosed in the central 700 pc of Arp 220 to explain the observed
emission. If we consider the luminosity
of Sgr B2(N) of ~107 L⊙ (de Vicente et al. 2000), such number of massive star
forming cores alone would easily account for the bolometric luminosity of Arp 220.
Such a concentration of hot cores would require an average distance of 3.5 − 5.6 pc between cores, assuming they are distributed isotropically within a spherical region of 700 pc diameter. Assuming them to be distributed within a disk with a thickness of ~200 pc would yield an average distance of 2.4−3.7 pc. These rough estimates are still larger than the projected distance of ~1.6 pc between the hot cores in the Sgr B2 molecular complex within the Galactic center region. Therefore the estimate of the number of hot cores in Arp 220 does not put severe constraints on the compactness of the star forming regions in this galaxy. However, it does imply a widespread intense star formation throughout its whole central region.
5.3. High temperature vibrationally excited molecular gas
Vibrationally excited HC3N emission probing the hot molecular component has been detected, so far, towards two extragalactic sources, the luminous infrared galaxy (LIRG) NGC 4418 and the ULIRG Arp 220 (Costagliola & Aalto 2010; Martín-Pintado, in prep.). Both galaxies show prominent silicate absorption features (Roche et al. 1986; Smith et al. 1989) which can be a sign of high temperature dust heated by hot young stars (Spoon et al. 2006). Within the Galaxy, vibrationally excited HC3N emission is found towards massive (Sgr B2 and Orion de Vicente et al. 2000, 2002) and intermediate (HW2, Martín-Pintado et al. 2005) star forming regions. Towards Arp 220 we find HC3N and CH3CN probing hot molecular gas with derived temperatures of Tex = 300 − 400 K. The critical densities of the HC3N observed transitions are ncrit > 106 cm-3 (Wernli et al. 2007). Thus, these species are tracing the densest and hottest molecular gas in Arp 220.
In Table 8 two sets of physical parameters are derived for HC3N. The first one takes only into account the pure rotational transitions of HC3N for which we derive a rotational temperature of Trot ~ 35 K. The second set of parameters with a temperature of Trot ~ 350 K are derived with the vibrationally excited transitions only. As observed towards the Sgr B2 molecular cloud in the Galactic Center region, both HC3N and CH3CN rotational emission arise from the same region and trace a molecular ridge containing the massive star forming regions (de Vicente et al. 1997). Vibrational emission, on the other hand, mostly arises from the hot cores, though it is not restricted to the core extent (de Vicente et al. 2000). In order to populate the vibrationally excited levels of the observed transitions, HC3N and CH3CN require IR photons in the range of 15−45 μm and 20−30 μm, respectively. While the rotational transitions arise from the warm envelope around the hot cores (40 − 80 K, 2 × 105 cm-3; de Vicente et al. 1997), the hot component will be directly tracing the innermost regions around the hot cores with temperatures well above 200 K (de Vicente et al. 2000). Thus, the excitation of both HC3N and CH3CN in Arp 220 agrees with its emission originating in Sgr B2-like regions.
6. Conclusions: AGN vs. SB driven chemistry
Up to now, the only available extragalactic molecular studies available as comparison templates are the unbiased study toward NGC 253 (Martín et al. 2006) and M 82 (Aladro et al., in prep.), and the targeted observations towards NGC 4945 (Wang et al. 2004). These studies have characterized the chemical complexity of starburst galaxies. The molecular abundances in Arp 220, resulting from the detected transitions in the 1.3 mm atmospheric window, do resemble those found towards the starburst galaxy NGC 253. The only species showing an outstanding abundance towards Arp 220 is H2S. Although the abundance of H2S has only been measured towards NGC 253, this overabundance is likely to be the result of grain disruption and subsequent H2S injection into gas phase in the early stages of star formation (Hatchell et al. 1998). This sets the burst of star formation in Arp 220 in a very early stage of evolution and thus, on average, younger than the starburst in NGC 253. This comparison suggests that the chemistry in Arp 220 is mostly driven by bursts of star formation where differences in the observed abundances can be accounted for by a difference in the state of evolution of the starbursts (Martín et al. 2006).
Unfortunately, no complete chemical templates of the ISM in the vicinity of AGNs are available and therefore the best tracers in highly X-ray irradiated regions are based on chemical models. The results from such models (Meijerink & Spaans 2005; Meijerink et al. 2006, 2007; Loenen et al. 2008) have motivated a number of observational studies focused on the species CO, HCN, HNC, HCO+, and CN (Pérez-Beaupuits et al. 2007; Krips et al. 2008; Baan et al. 2008; Pérez-Beaupuits et al. 2009). The HCN/HCO+ ratio was used by (Aalto et al. 2007a) to evaluate the presence of an AGN on the LIRG NGC 4418 which, like Arp 220, has a heavily obscured nucleus. The HCN and HCO+ comparative study by Krips et al. (2008) shows how the HCN/HCO+ ratios in Arp 220 are similar to those measured in NGC 1068, the prototypical AGN galaxy. However the excitation of HCN differs significantly in both galaxies (Krips et al. 2008). On the other hand, though overluminous HNC emission in Arp 220 could be attributed to either pumping through mid-IR photons or the presence of an XDR region (Aalto et al. 2007b), the observed HNC/HCN ratio suggest a PDR rather than a XDR origin (Baan et al. 2008, 2010). We estimate a column density ratio CN/HCN ~ 0.5, where we have used the single-dish HCN observations by Krips et al. (2008) and our survey measurement of the CN emission. To estimate the HCN column density we assumed a source size of 2′′ similar to the one used in this paper. This ratio is lower than the range CN/HCN ~ 1−4 that (Pérez-Beaupuits et al. 2009) claims as indicative of XDR regions. Therefore, the CN emission does not appear to be enhanced as observed in the circumnuclear disk of NGC 1068 (García-Burillo et al. 2010). Moreover, García-Burillo et al. (2010) found an enhancement of SiO in this region, which does not seem to be particularly prominent in Arp 220 as compared to NGC 253. Therefore, we do not find any molecular emission that could be attributed to X-ray driven chemistry in the nuclear region of Arp 220.
Measured isotopologues ratios appear to point to both large opacities affecting the main
isotopologues of most observed species and an enriched molecular material in the nuclear
region of Arp 220. ISM enrichment towards Arp 220 is similar or even enhanced with respect
to that found in other starbursts, such as NGC 253 and M 82, as a consequence of a series of
consecutive short and intense starburst events (Parra et al.
2007). Among the isotopologues, the observed
HO luminosity can be accounted for by the
emission of a few 106 hot molecular cores associated with the massive star
formation within the central 700 pc of Arp 220. Such a concentration of cores could be
responsible for the whole bolometric luminosity of this galaxy, rendering unnecessary a
significant contribution to the luminosity by a deeply embedded AGN. Far from the
H2O atmospheric absorption, the optically thin emission of
HO is proven to be one of the best tracers of
massive star forming hot cores in highly obscured nuclei of galaxies.
The importance of the star formation within the nuclear region of Arp 220 is further supported by the detection of vibrationally excited emission of HC3N and CH3CN, with vibrational temperatures > 300 K. Such emission is also tracing the molecular component associated with hot cores as reported by Martín-Pintado (in prep.). However, vibrationally excited HC3N emission with a temperature of 500 K towards NGC 4418 could be understood as a compact and deeply embedded AGN, heating up the surrounding material (Costagliola & Aalto 2010). It is remarkable that such vibrationally excited emission has never been reported towards nearby starbursts. The detection towards the ULIRG Arp 220 and the LIRG NGC 4418, might be due to the significantly larger contribution of hot core emission as a consequence of the higher star formation rates in these galaxies. Large opacities affect the pure rotational transitions of HC3N (Sect. 5.2). Due to the large continuum opacity at 1 mm (Downes & Eckart 2007), the molecular emission we observed cannot arise from the vicinity of an AGN. Indeed, the simple models presented Schleicher et al. (2010) show the heating sphere of influence of a supermassive AGN to be limited to the central ~100 pc while the starburst heating dominates outside this volume. Therefore, the hot gas where the vibrationally excited emission of CH3CN and HC3N cannot be tracing the regions around the Compton thick AGN but must arise from other regions likely unaffected by the AGN radiation and purely heated by the starbursting events in Arp 220.
7. Summary
In this paper we present the study of a 1.3 mm wavelength scan of Arp 220 covering the 40 GHz range between the rest frequencies of 202 and 242 GHz.
Molecular line emission is detected over more than 80% of the observed band. Continuum emission, previously overstimated in several works due to line contamination, has been estimated from the few line free regions of the spectrum. We derive an average 1.3 mm continuum flux of 142 mJy, ranging from 129 to 154 mJy across the band. The total line contribution to the overall flux measured in the 40 GHz band is estimated to be ~28%, while CO emission alone accounts for only ~9%. Therefore line contamination to thermal continuum is shown to be more critical than the non-thermal contribution which only counts for a 3–6% of the total flux density at these frequencies.
We present maps of the CO emission detected in the VLSR range between 4950 and 5750 km s-1. This map likely recovers all the single-dish detected flux thanks to the short baselines in the SMA sub-compact configuration.
A total of 73 spectral features are detected, implying a detection rate of 1.8 lines/GHz.
15 molecular species and 6 isotopologues are identified. The 13C isotopologues of
HC3N, as well as HO, 29SiO, and CH2CO,
are reported for the first time in the extragalactic ISM. The lines in the entire 40 GHz
spectrum have been fitted to the molecular emission of the identified species assuming LTE
conditions. Of the ~3000 transitions used to perform the fit, only 163 are detected
above a 1σ level.
The molecular composition and abundances derived from the modelling favor a purely
starburst powering source in Arp 220. This conclusion is based on the direct comparison with
the molecular abundances derived for the nearby starburst galaxy NGC 253, as well as the
detection of the water isotopologue, HO, and vibrationally excited emission of
HC3N and CH3CN, which are likely tracing the hot cores associated
with the massive star formation sites within the nuclear region of Arp 220. The comparison
with NGC 253 chemistry shows a prominent overabundance of H2S which can be
plausibly interpreted as Arp 220 being in a very early stage of its burst of star formation,
as predicted by chemical models (Hatchell et al.
1998).
Though deep sensitive observations are required to accurately constrain the isotopic ratios in Arp 220, our measurements suggest the presence of an isotopic enrichment similar to or more prominent than that towards nearby starbursts. The large opacities of the main isotopologues prevent us from getting further constraints from the observed isotopologue abundance ratios. Indeed an effect of the opacity in HC3N likely similar to that in CO is found.
From our HO and C18O measurements we
estimate a water abundance of
XH2O = 1.7 × 10⁻⁵ without assumptions on
the 16O/18O isotopic ratio. This abundance agrees with that derived
towards the Galactic hot cores (Gensheimer et al.
1996; Cernicharo et al. 2006a). Assuming all
the HO emission comes from the massive star
forming hot cores within the nuclear region of Arp 220, the
HO luminosity of
3.9 × 10⁷ K km-1 pc2 within the central 2′′ would
require a ~2−8 × 10⁶ Sgr B2-like hot cores enclosed within its inner
700 pc. The detected vibrationally excited transitions of HC3N and
CH3CN trace a molecular component with temperatures between 300 and 400 K. Within
the Galaxy, such emission is only observed from hot molecular cores (de Vicente et al. 2000, 2002).
We have not found chemical evidence for the presence of a buried AGN in the nuclei of Arp 220. Though likely present as suggested in various studies (Downes & Eckart 2007, and references therein), the suspected black hole has no observable effects in the heating of the nuclear ISM in this galaxy. Moreover, the starburst contribution alone would be able to explain the huge infrared emission observed in Arp 220.
Acknowledgments
The Submillimeter Array is a joint project between the Smithsonian Astrophysical Observatory and the Academia Sinica Institute of Astronomy and Astrophysics and is funded by the Smithsonian Institution and the Academia Sinica.
References
- Aalto, S., Johansson, L. E. B., Booth, R. S., & Black, J. H. 1991, A&A, 249, 323 [Google Scholar]
- Aalto, S., Booth, R. S., Black, J. H., & Johansson, L. E. B. 1995, A&A, 300, 369 [NASA ADS] [Google Scholar]
- Aalto, S., Monje, R., & Martín, S. 2007a, A&A, 475, 479 [NASA ADS] [CrossRef] [EDP Sciences] [Google Scholar]
- Aalto, S., Spaans, M., Wiedner, M. C., & Hüttemeister, S. 2007b, A&A, 464, 193 [NASA ADS] [CrossRef] [EDP Sciences] [Google Scholar]
- Aalto, S., Wilner, D., Spaans, M., et al. 2009, A&A, 493, 481 [NASA ADS] [CrossRef] [EDP Sciences] [Google Scholar]
- Albrecht, M., Krügel, E., & Chini, R. 2007, A&A, 462, 575 [NASA ADS] [CrossRef] [EDP Sciences] [Google Scholar]
- Anantharamaiah, K. R., Viallefond, F., Mohan, N. R., Goss, W. M., & Zhao, J. H. 2000, ApJ, 537, 613 [NASA ADS] [CrossRef] [Google Scholar]
- Baan, W. A., Henkel, C., Loenen, A. F., Baudry, A., & Wiklind, T. 2008, A&A, 477, 747 [NASA ADS] [CrossRef] [EDP Sciences] [Google Scholar]
- Baan, W. A., Loenen, A. F., & Spaans, M. 2010, A&A, 516, A40 [NASA ADS] [CrossRef] [EDP Sciences] [Google Scholar]
- Carico, D. P., Keene, J., Soifer, B. T., & Neugebauer, G. 1992, PASP, 104, 1086 [NASA ADS] [CrossRef] [Google Scholar]
- Casoli, F., Dupraz, C., & Combes, F. 1992, A&A, 264, 49 [NASA ADS] [Google Scholar]
- Cernicharo, J., Goicoechea, J. R., Pardo, J. R., & Asensio-Ramos, A. 2006a, ApJ, 642, 940 [NASA ADS] [CrossRef] [Google Scholar]
- Cernicharo, J., Pardo, J. R., & Weiss, A. 2006b, ApJ, 646, L49 [NASA ADS] [CrossRef] [Google Scholar]
- Chin, Y., Henkel, C., Whiteoak, J. B., Langer, N., & Churchwell, E. B. 1996, A&A, 305, 960 [NASA ADS] [Google Scholar]
- Clements, D. L., McDowell, J. C., Shaked, S., et al. 2002, ApJ, 581, 974 [NASA ADS] [CrossRef] [Google Scholar]
- Combes, F., & Wiklind, T. 1998, A&A, 334, L81 [NASA ADS] [Google Scholar]
- Costagliola, F., & Aalto, S. 2010, A&A, 515, A71 [NASA ADS] [CrossRef] [EDP Sciences] [Google Scholar]
- de Vicente, P., Martin-Pintado, J., & Wilson, T. L. 1997, A&A, 320, 957 [NASA ADS] [Google Scholar]
- de Vicente, P., Martín-Pintado, J., Neri, R., & Colom, P. 2000, A&A, 361, 1058 [NASA ADS] [Google Scholar]
- de Vicente, P., Martín-Pintado, J., Neri, R., & Rodríguez-Franco, A. 2002, ApJ, 574, L163 [NASA ADS] [CrossRef] [Google Scholar]
- Dopita, M. A., Groves, B. A., Fischera, J., et al. 2005, ApJ, 619, 755 [NASA ADS] [CrossRef] [Google Scholar]
- Downes, D. 1989, in Evolution of Galaxies: Astronomical Observations, ed. I. Appenzeller, H. J. Habing, & P. Lena, Lecture Notes in Physics (Berlin: Springer Verlag), 333, 351 [Google Scholar]
- Downes, D., & Solomon, P. M. 1998, ApJ, 507, 615 [NASA ADS] [CrossRef] [Google Scholar]
- Downes, D., & Eckart, A. 2007, A&A, 468, L57 [NASA ADS] [CrossRef] [EDP Sciences] [Google Scholar]
- García-Burillo, S., Usero, A., Fuente, A., et al. 2010, A&A, 519, A2 [NASA ADS] [CrossRef] [EDP Sciences] [Google Scholar]
- Garozzo, M., Fulvio, D., Kanuchova, Z., Palumbo, M. E., & Strazzulla, G. 2010, A&A, 509, A67 [NASA ADS] [CrossRef] [EDP Sciences] [Google Scholar]
- Geballe, T. R., Goto, M., Usuda, T., Oka, T., & McCall, B. J. 2006, ApJ, 644, 907 [NASA ADS] [CrossRef] [Google Scholar]
- Gensheimer, P. D., Mauersberger, R., & Wilson, T. L. 1996, A&A, 314, 281 [NASA ADS] [Google Scholar]
- Genzel, R., Lutz, D., Sturm, E., et al. 1998, ApJ, 498, 579 [NASA ADS] [CrossRef] [Google Scholar]
- González-Alfonso, E., Smith, H. A., Fischer, J., & Cernicharo, J. 2004, ApJ, 613, 247 [NASA ADS] [CrossRef] [Google Scholar]
- Graham, J. R., Carico, D. P., Matthews, K., et al. 1990, ApJ, 354, L5 [NASA ADS] [CrossRef] [Google Scholar]
- Greve, T. R., Papadopoulos, P. P., Gao, Y., & Radford, S. J. E. 2009, ApJ, 692, 1432 [NASA ADS] [CrossRef] [Google Scholar]
- Groesbeck, T. D., Phillips, T. G., & Blake, G. A. 1994, ApJS, 94, 147 [NASA ADS] [CrossRef] [Google Scholar]
- Harrison, A., Henkel, C., & Russell, A. 1999, MNRAS, 303, 157 [NASA ADS] [CrossRef] [Google Scholar]
- Hatchell, J., Thompson, M. A., Millar, T. J., & MacDonald, G. H. 1998, A&A, 338, 713 [NASA ADS] [Google Scholar]
- Helmich, F. P., & van Dishoeck, E. F. 1997, A&AS, 124, 205 [NASA ADS] [CrossRef] [EDP Sciences] [Google Scholar]
- Henkel, C., & Mauersberger, R. 1993, A&A, 274, 730 [NASA ADS] [Google Scholar]
- Henkel, C., Mauersberger, R., Wiklind, T., et al. 1993, A&A, 268, L17 [NASA ADS] [Google Scholar]
- Herpin, F., Marseille, M., Wakelam, V., Bontemps, S., & Lis, D. C. 2009, A&A, 504, 853 [NASA ADS] [CrossRef] [EDP Sciences] [Google Scholar]
- Huettemeister, S., Henkel, C., Mauersberger, R., et al. 1995, A&A, 295, 571 [NASA ADS] [Google Scholar]
- Iwasawa, K., Matt, G., Guainazzi, M., & Fabian, A. C. 2001, MNRAS, 326, 894 [NASA ADS] [CrossRef] [Google Scholar]
- Iwasawa, K., Sanders, D. B., Evans, A. S., et al. 2005, MNRAS, 357, 565 [NASA ADS] [CrossRef] [Google Scholar]
- Jacq, T., Henkel, C., Walmsley, C. M., Jewell, P. R., & Baudry, A. 1988, A&A, 199, L5 [NASA ADS] [Google Scholar]
- Joseph, R. D., & Wright, G. S. 1985, MNRAS, 214, 87 [NASA ADS] [Google Scholar]
- Kawaguchi, K., Kasai, Y., Ishikawa, S., & Kaifu, N. 1995, PASJ, 47, 853 [Google Scholar]
- Kim, D., Veilleux, S., & Sanders, D. B. 2002, ApJS, 143, 277 [NASA ADS] [CrossRef] [Google Scholar]
- Koda, J., & Subaru Cosmos Team. 2009, in Astronomical Society of the Pacific Conference Series, ed. W. Wang, Z. Yang, Z. Luo, & Z. Chen, ASP Conf. Ser., 408, 22 [Google Scholar]
- Krips, M., Neri, R., García-Burillo, S., et al. 2008, ApJ, 677, 262 [NASA ADS] [CrossRef] [Google Scholar]
- Lis, D. C., & Goldsmith, P. F. 1990, ApJ, 356, 195 [NASA ADS] [CrossRef] [Google Scholar]
- Loenen, A. F., Spaans, M., Baan, W. A., & Meijerink, R. 2008, A&A, 488, L5 [NASA ADS] [CrossRef] [EDP Sciences] [Google Scholar]
- Lonsdale, C. J., Lonsdale, C. J., Diamond, P. J., & Smith, H. E. 1998, ApJ, 493, L13 [NASA ADS] [CrossRef] [Google Scholar]
- Lonsdale, C. J., Diamond, P. J., Thrall, H., Smith, H. E., & Lonsdale, C. J. 2006, ApJ, 647, 185 [NASA ADS] [CrossRef] [Google Scholar]
- Martín, S. 2009, in Astronomical Society of the Pacific Conference Series, ed. K. J. Meech, J. V. Keane, M. J. Mumma, J. L. Siefert, & D. J. Werthimer , ASP Conf. Ser., 420, 19 [Google Scholar]
- Martín, S., Martín-Pintado, J., Mauersberger, R., Henkel, C., & García-Burillo, S. 2005, ApJ, 620, 210 [NASA ADS] [CrossRef] [Google Scholar]
- Martín, S., Mauersberger, R., Martín-Pintado, J., Henkel, C., & García-Burillo, S. 2006, ApJS, 164, 450 [NASA ADS] [CrossRef] [Google Scholar]
- Martín, S., Martín-Pintado, J., & Mauersberger, R. 2009a, ApJ, 694, 610 [NASA ADS] [CrossRef] [Google Scholar]
- Martín, S., Martín-Pintado, J., & Viti, S. 2009b, ApJ, 706, 1323 [NASA ADS] [CrossRef] [Google Scholar]
- Martín, S., Aladro, R., Martín-Pintado, J., & Mauersberger, R. 2010, A&A, 522, A62 [NASA ADS] [CrossRef] [EDP Sciences] [Google Scholar]
- Martín-Pintado, J., Jiménez-Serra, I., Rodríguez-Franco, A., Martín, S., & Thum, C. 2005, ApJ, 628, L61 [NASA ADS] [CrossRef] [Google Scholar]
- Matsushita, S., Iono, D., Petitpas, G. R., et al. 2009, ApJ, 693, 56 [NASA ADS] [CrossRef] [Google Scholar]
- Mattila, S., & Meikle, W. P. S. 2001, MNRAS, 324, 325 [NASA ADS] [CrossRef] [Google Scholar]
- McDowell, J. C., Clements, D. L., Lamb, S. A., et al. 2003, ApJ, 591, 154 [NASA ADS] [CrossRef] [Google Scholar]
- Meijerink, R., & Spaans, M. 2005, A&A, 436, 397 [NASA ADS] [CrossRef] [EDP Sciences] [Google Scholar]
- Meijerink, R., Spaans, M., & Israel, F. P. 2006, ApJ, 650, L103 [NASA ADS] [CrossRef] [Google Scholar]
- Meijerink, R., Spaans, M., & Israel, F. P. 2007, A&A, 461, 793 [NASA ADS] [CrossRef] [EDP Sciences] [Google Scholar]
- Müller, H. S. P., Schlöder, F., Stutzki, J., & Winnewisser, G. 2005, J. Molecul. Structure, 742, 215 [CrossRef] [Google Scholar]
- Müller, H. S. P., Thorwirth, S., Roth, D. A., & Winnewisser, G. 2001, A&A, 370, L49 [NASA ADS] [CrossRef] [EDP Sciences] [Google Scholar]
- Mundell, C. G., Ferruit, P., & Pedlar, A. 2001, ApJ, 560, 168 [NASA ADS] [CrossRef] [Google Scholar]
- Norris, R. P. 1988, MNRAS, 230, 345 [NASA ADS] [Google Scholar]
- Nummelin, A., Bergman, P., Hjalmarson, Å., et al. 2000, ApJS, 128, 213 [NASA ADS] [CrossRef] [Google Scholar]
- Parra, R., Conway, J. E., Diamond, P. J., et al. 2007, ApJ, 659, 314 [NASA ADS] [CrossRef] [Google Scholar]
- Penzias, A. A. 1981, ApJ, 249, 518 [NASA ADS] [CrossRef] [Google Scholar]
- Pérez-Beaupuits, J. P., Aalto, S., & Gerebro, H. 2007, A&A, 476, 177 [NASA ADS] [CrossRef] [EDP Sciences] [Google Scholar]
- Pérez-Beaupuits, J. P., Spaans, M., van der Tak, F. F. S., et al. 2009, A&A, 508, 209 [NASA ADS] [CrossRef] [EDP Sciences] [Google Scholar]
- Pickett, H. M., Poynter, I. R. L., Cohen, E. A., et al. 1998, J. Quant. Spectros. Radiat. Transfer, 60, 883 [Google Scholar]
- Roche, P. F., Aitken, D. K., Smith, C. H., & James, S. D. 1986, MNRAS, 218, 19P [NASA ADS] [CrossRef] [Google Scholar]
- Sakamoto, K., Scoville, N. Z., Yun, M. S., et al. 1999, ApJ, 514, 68 [NASA ADS] [CrossRef] [Google Scholar]
- Sakamoto, K., Wang, J., Wiedner, M. C., et al. 2008, ApJ, 684, 957 [NASA ADS] [CrossRef] [Google Scholar]
- Salter, C. J., Ghosh, T., Catinella, B., et al. 2008, AJ, 136, 389 [NASA ADS] [CrossRef] [Google Scholar]
- Schleicher, D. R. G., Spaans, M., & Klessen, R. S. 2010, A&A, 513, A7 [NASA ADS] [CrossRef] [EDP Sciences] [Google Scholar]
- Scoville, N. Z., Yun, M. S., & Bryant, P. M. 1997, ApJ, 484, 702 [NASA ADS] [CrossRef] [Google Scholar]
- Scoville, N. Z., Evans, A. S., Dinshaw, N., et al. 1998, ApJ, 492, L107 [NASA ADS] [CrossRef] [Google Scholar]
- Smith, C. H., Aitken, D. K., & Roche, P. F. 1989, MNRAS, 241, 425 [NASA ADS] [CrossRef] [Google Scholar]
- Smith, H. E., Lonsdale, C. J., Lonsdale, C. J., & Diamond, P. J. 1998, ApJ, 493, L17 [NASA ADS] [CrossRef] [Google Scholar]
- Spoon, H. W. W., Tielens, A. G. G. M., Armus, L., et al. 2006, ApJ, 638, 759 [NASA ADS] [CrossRef] [Google Scholar]
- Teng, S. H., Veilleux, S., Anabuki, N., et al. 2009, ApJ, 691, 261 [NASA ADS] [CrossRef] [Google Scholar]
- Thronson, Jr., H. A.,Walker, C. K., Walker, C. E., & Maloney, P. 1987, ApJ, 318, 645 [NASA ADS] [CrossRef] [Google Scholar]
- Ulvestad, J. S., & Antonucci, R. R. J. 1997, ApJ, 488, 621 [NASA ADS] [CrossRef] [Google Scholar]
- van der Tak, F. F. S., Aalto, S., & Meijerink, R. 2008, A&A, 477, L5 [NASA ADS] [CrossRef] [EDP Sciences] [Google Scholar]
- van der Werf, P. P., Isaak, K. G., Meijerink, R., et al. 2010, A&A, 518, L42 [NASA ADS] [CrossRef] [EDP Sciences] [Google Scholar]
- Varshalovich, D. A., Ivanchik, A. V., Petitjean, P., Srianand, R., & Ledoux, C. 2001, Astron. Lett., 27, 683 [NASA ADS] [CrossRef] [Google Scholar]
- Veilleux, S., Sanders, D. B., & Kim, D. 1999, ApJ, 522, 139 [NASA ADS] [CrossRef] [Google Scholar]
- Wang, M., Chin, Y., Henkel, C., Whiteoak, J. B., & Cunningham, M. 2009, ApJ, 690, 580 [NASA ADS] [CrossRef] [Google Scholar]
- Wang, M., Henkel, C., Chin, Y., et al. 2004, A&A, 422, 883 [NASA ADS] [CrossRef] [EDP Sciences] [Google Scholar]
- Weiß, A., Requena-Torres, M. A., Güsten, R., et al. 2010, A&A, 521, L1 [NASA ADS] [CrossRef] [EDP Sciences] [Google Scholar]
- Wernli, M., Wiesenfeld, L., Faure, A., & Valiron, P. 2007, A&A, 464, 1147 [NASA ADS] [CrossRef] [EDP Sciences] [Google Scholar]
- Wiedner, M. C., Wilson, C. D., Harrison, A., et al. 2002, ApJ, 581, 229 [NASA ADS] [CrossRef] [Google Scholar]
- Wolff, R. S. 1980, ApJ, 242, 1005 [NASA ADS] [CrossRef] [Google Scholar]
- Woody, D. P., Scott, S. L., Scoville, N. Z., et al. 1989, ApJ, 337, L41 [NASA ADS] [CrossRef] [Google Scholar]
All Tables
All Figures
|
Fig. 1 Summary of the frequency coverage of the line survey between 202 GHz and 242 GHz. The central frequency of each band is indicated. The pair of lower (LSB) and upper (USB) sidebands in the observations are indicated by shading the same grey scale. The gap between observed bands is 16 MHz but for the two frequencies shown in the center of the graphic (at 212.016 and 231.936 GHz) where the coverage gap width is 96 MHz. |
| In the text | |
|
Fig. 2 Composite of the 1.3 mm frequency scan carried out with the SMA between 202 and
242 GHz. Each individual spectrum was extracted from the natural weighted datacubes
at the peak of emission position |
| In the text | |
|
Fig. 3 Power law fit to the continuum measurements in molecular emission free bands across the whole 40 GHz surveyed (see Table 3). Fit to all measurements (dotted line) result in a dependance as Sν ∝ ν1.3. The final fit applied to the data (solid line), as derived from the measurements represented by filled squares, shows a power law dependance as Sν ∝ ν1.0. Error bars represent the rms with respect to the average within each selected frequency range. See text in Sect. 3 for details. |
| In the text | |
|
Fig. 4 Robust weighted images of the continuum emission (grey scale) and CO J = 2−1 integrated flux (contours) at a resolution of 2.9′′ × 1.9′′. Continuum emission has been estimated from the 230.904 GHz setup in the ranges not affected by CO or 13CS. The stars represent the position of the 1.3 mm continuum sources from the high resolution images of Sakamoto et al. (1999). Contours are 3σ significant levels of 14 mJy beam-1 and 49 Jy km s-1 for the continuum and line flux, respectively. |
| In the text | |
|
Fig. 5 CO J = 2−1 channel maps in steps of 50 km s-1. First 3 contours are 3σ significant and then 6σ up to 100σ, with σ = 19 mJy. The number at top-left in each panel denotes the LSR velocity in km s-1. |
| In the text | |
|
Fig. 6 Detailed view of the spectral line survey. Spectral resolution of the observed data is smoothed to 20.5 MHz (25 − 30 km s-1 across the covered frequency range). The LTE model of the identified molecular species is represented as a thick solid curve. The identified molecular features are labeled. |
| In the text | |
|
Fig. 7 Comparison of the fractional abundances relative to H2 derived for the two velocity components in Arp 220 and those measured in the starburst galaxy NGC 253. Abundances for NGC 253 derived Martín et al. (2006) and H2 derived from C18O (Harrison et al. 1999). |
| In the text | |
|
Fig. 8 (Upper panel) Comparison of the fractional abundances relative to 13CS derived for the two velocity components in Arp 220 and those measured in the starburst galaxy NGC 253. (Lower panel) Ratio of the relative abundances of each velocity component in Arp 220 and in NGC 253. Horizontal dotted lines are set to indicate a ratio of factor of 2 with the aim of guiding the eye in the comparison. Differences below a factor of 2 are not considered representative. |
| In the text | |
Current usage metrics show cumulative count of Article Views (full-text article views including HTML views, PDF and ePub downloads, according to the available data) and Abstracts Views on Vision4Press platform.
Data correspond to usage on the plateform after 2015. The current usage metrics is available 48-96 hours after online publication and is updated daily on week days.
Initial download of the metrics may take a while.