Fig. 10
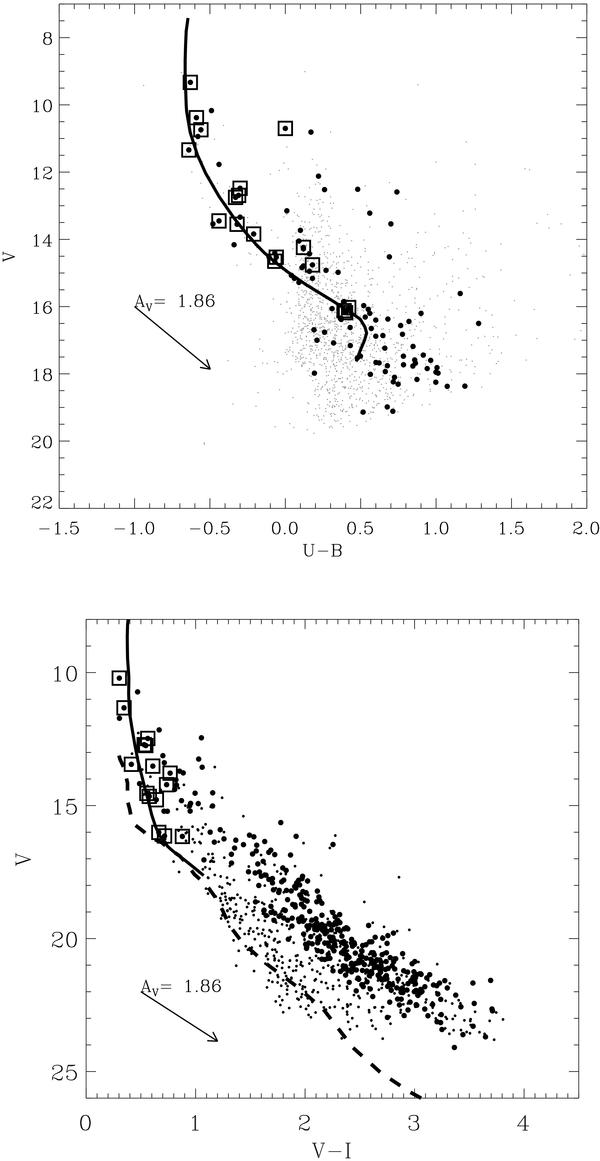
V vs. U − B diagram from the Massey et al. (1995) and Sharma et al. (2007) photometry (upper panels) and V vs. V − I diagram of all the objects with errors in V − I smaller than 0.1 and located in the regions with AV > 3.8 (bottom panels). Filled circles are the diskless candidate cluster members; squares are those with 0.5 < E(B − V) < 0.7; solid line is the 3.0 Myr isochrone of solar metallicity using E(B − V) = 0.6, while dashed line is the solar metallicity ZAMS of Siess et al. (2000) using E(B − V) = 0.4; both are drawn assuming a distance of 3.6 kpc. The reddening vector obtained using the Munari & Carraro (1996) reddening laws is also shown.
Current usage metrics show cumulative count of Article Views (full-text article views including HTML views, PDF and ePub downloads, according to the available data) and Abstracts Views on Vision4Press platform.
Data correspond to usage on the plateform after 2015. The current usage metrics is available 48-96 hours after online publication and is updated daily on week days.
Initial download of the metrics may take a while.