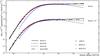
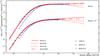
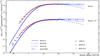
Fig. 7

TOA (modulated) fluxes (times  ) as a function of the kinetic
energy per nucleon, for p and He. The symbols are black circles for AMS-01, red
squares for BESS-98, and blue triangles for BESS-TeV. The curves correspond (for
the four models of Table 2) to the
best-fit spectra obtained by a fit on the AMS-01 data (top
panel), BESS98 data (middle panel) and BESS-TeV data
(bottom panel).
) as a function of the kinetic
energy per nucleon, for p and He. The symbols are black circles for AMS-01, red
squares for BESS-98, and blue triangles for BESS-TeV. The curves correspond (for
the four models of Table 2) to the
best-fit spectra obtained by a fit on the AMS-01 data (top
panel), BESS98 data (middle panel) and BESS-TeV data
(bottom panel).
Current usage metrics show cumulative count of Article Views (full-text article views including HTML views, PDF and ePub downloads, according to the available data) and Abstracts Views on Vision4Press platform.
Data correspond to usage on the plateform after 2015. The current usage metrics is available 48-96 hours after online publication and is updated daily on week days.
Initial download of the metrics may take a while.