| Issue |
A&A
Volume 526, February 2011
|
|
|---|---|---|
| Article Number | A116 | |
| Number of page(s) | 9 | |
| Section | Stellar atmospheres | |
| DOI | https://doi.org/10.1051/0004-6361/201015912 | |
| Published online | 10 January 2011 | |
Neutral and ionized emission lines in the type II Cepheid W Virginis ⋆,⋆⋆
1
Astronomical Observatory, Odessa National University,
T.G. Shevchenko Park,
65014
Odessa,
Ukraine
e-mail: This email address is being protected from spambots. You need JavaScript enabled to view it.
2
Department of Astronomy, University of Washington,
Seattle, WA
98195,
USA
e-mail: This email address is being protected from spambots. You need JavaScript enabled to view it.
3
Observatoire de Haute-Provence, 04870
Saint-Michel Observatoire,
France
4
Institute for Astronomy of the Russian Academy o
Sciences, Moscow,
Russia
5
American Association of Variable star Observers,
49 Bay state road
Cambridge, MA
02138,
USA
Received: 12 October 2010
Accepted: 7 December 2010
Abstract
Aims. The aim of this work was to perform a multiphase spectroscopic study of W Vir which represents stars of the class of population II Cepheids, in order to trace the behaviour of emission features in different lines, and to use the data to describe the dynamical processes in the atmosphere of this star associated with the shock wave propagation.
Methods. Our spectroscopic study of W Vir involved 18 high-resolution spectra obtained with the help of 3.5-m telescope of Apache Point Observatory. These spectra cover W Vir’s pulsational cycle with good phase resolution that enabled us to precisely fix the intervals of appearance, existence and disappearance of many anomalous spectral features, as well as to construct their radial velocity curves.
Results. We detected and investigated the behaviour of emission and line doubling in many metallic lines (Na I, Fe I, Fe II, Ba II etc), as well as in hydrogen and helium lines. Analysis of the temporal characteristics of those emission features allowed us to make, in particular, the following conclusion.
Conclusions. W Vir consists of two parts: the inner part, which is, in fact, a pulsating star itself with periodic shocks penetrating into the upper atmosphere, an outer one – a circumstellar envelope. The interaction of the main shock wave with the infalling envelope layers can explain the observed peculiarities of the spectral line variability.
Key words: stars: atmospheres / stars: variables: Cepheids
Based on spectra collected at the Apache Point Observatory, which is managed by The Astrophysical Research Consortium.
Table A.1 (Appendix) and original spectra are only available in electronic form at the CDS via anonymous ftp to cdsarc.u-strasbg.fr (130.79.128.5) or via http://cdsarc.u-strasbg.fr/viz-bin/qcat?J/A+A/526/A116
© ESO, 2011
1. Introduction
In 1938 Joy recognized the differences between W Vir and the classical Cepheids he was surveying. High resolution spectra of W Vir were first obtained by Sanford (1953), in which doubled absorption lines and hydrogen emission lines with inverse P-Cygni profiles were present from the near minimum light until about phase 0.1 past light maximum.
These kind of profiles indicate that a shock-wave is passing through the atmosphere during rising light. This interpretation had originally been suggested by Schwarzschild (1953) as a comment at the 1952 IAU Meeting after Sanford’s presentation of the spectra of W Vir with double absorption lines and H emission lines, and the first quantitative model has been developed by Whitney (1956a,b) as reported by Wallerstein (1959).
Surprisingly, the emission lines of He I on Sanford’s plates were overlooked by Sanford and others until rediscovered by Wallerstein (1959). The He I emission lines served to confirm the shock model since they indicated that the high temperature behind the shock was sufficient to ionize He once, as well as H. The shock models was further developed by Whitney & Scalafuris (1963). New observation with the Palomar coude spectrograph by Raga & Wallerstein (1989) served to derive the ratio of H/He in W Vir atmosphere. A further evaluation and improvement in the shock model by Lébre & Gillet (1992) made use of the new high resolution spectra over the whole cycle.
In this paper we call attention to the numerous emission lines of Fe I and other species and trace their appearances and radial velocities. We discuss very briefly the origin of the neutral emission lines but do not attempt to derive a principally new model for the star’s pulsation. This follows the advice of Walter Baade to G.W. when he was considering the type II Cepheids for a thesis topic: “Just get the kinematics straight. Don’t worry about the spectroscopic nonsense”.
2. Observations
As a part of a program to derive the chemical composition of certain type II Cepheids and RR Lyrae stars, we have obtained spectra of W Vir with the echelle spectrograph of the 3.5-m telescope at the Apache Point Observatory. These spectra have a resolving power of about 35 000 and cover the full wavelength from 3500 Å to 10 400 Å though with rather low S/N below 3900 Å and above 8800 Å. The uncertainty in the determination of velocities is a few tenths of km s-1. This value is typical for a resolving power of 35 000 and a signal-to-noise ratio greater than 50.
On a spectrum obtained on March 2002 (= JD 2452336.802) we have found emission lines of neutral metals. Further spectra were obtained in a concentrated campaign during the succeeding months to explore the presence of these lines over a significant part of the star’s 17 day cycle. The spectra were reduced by standard methods in IRAF and measured with the computer package DECH20 (Galazutdinov, priv. comm.).
We alerted the AAVSO to the need for a simultaneous light curve to properly phase our spectroscopic observations. In Table 1 we list photometric phases reported by Templeton & Henden (2007) that correspond to our spectroscopic observations. It is very important to note that according to Abt (1954) individual cycles of W Vir sometimes show phase jitter by 0.1. Thus, a very precise phase fix of spectroscopic observations must be obtained for the specific cycle that was covered.
Observations.
3. Results of previous detailed spectroscopic studies of W Vir
The most comprehensive spectroscopic study of W Vir that covered a whole pulsation cycle with high time resolution has been performed by Lébre & Gillet (1992). Since the authors used AURELIE spectra, the resolving power was about 22 000, and it was possible to record only restricted spectral regions. Lébre & Gillet concentrated on Hα, He I, and the Na I D1,2 lines. They also reported emission by the Ni I line that lies between the 2 Na I lines. By analyzing four iron absorption lines (located at the same sections of the spectrum as the hydrogen and helium lines) they derived the velocity, radius and acceleration variations during the pulsation cycle. An acceleration curve shows a prominent peak at φ = 0.8, near minimum radius and just before maximum light. Such a sudden increase of acceleration is connected with a strong shock wave propagating through the W Vir atmosphere. The authors explained the profile of the Hα line as a combination of one emission component originating from the gas behind the shock wave, and three absorptions: one of which is photospheric, and two relatively narrow absorptions, which are produced by the gas above the shock wave front. Helium emission lines were detected by Lébre & Gillet between φ = 0.83 and 0.01.
4. Emission features in spectra of W Vir
On 2002 March 3, emission lines of neutral iron were seen. Despite all the spectra of W Vir that have been taken over the past 70 years, emission by neutral metals has been reported only by Lébre & Gillet (1992), and only in one Ni I 5893 line (phases 0.74 and 0.83). This was probably due to the fact that for the bright stars the observations with photographic plates were common in the past, but little work has been done with CCD’s since they were introduced only in the 1980’s.
Upon careful inspection we found that many emission lines from neutral and ionized species are present. In Table A.1 of the appendix we list the lines of species seen in emission at phase 0.666. Almost all lines present are from neutral atoms with the exception of lines of Fe II and some easily ionized species. The line intensities are related to the continuum by their equivalent widths in mÅ units. We have no calibration of the continuum flux as a function of wavelength. Lines of strength less than 15 mÅ are uncertain but a sufficient number of wavelength coincidences are present to suggest that they are real but of lower accuracy for their intensities as compared with stronger lines.
For each emission line given in Table A.1 we list its identification. the multiplet number, equivalent width, the excitation potentials and statistical weights for the lower and upper levels (with the relevant energies). In the final column the logarithm of the emission transition probability is given. Some examples of the W Vir emission lines at three phases are showed in Fig. 1, while in Figs. 2 and 3 we show, how the emission in Fe I and Fe II change with phase.
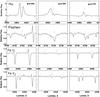 |
Fig. 1 Emissions in different lines. |
 |
Fig. 2 Emissions in Fe I lines 6393.6 Å and 6400.0 Å. |
 |
Fig. 3 Fe II emission. |
Figure 4 demonstrate the relative behavior of the emission lines of the helium and iron lines with pulsation phase, and Fig. 5 shows the radial velocities derived for metallic lines (see also Table 2). As one can see from Fig. 4, Fe II emission appears just after the Fe I emission, which is present from phases 0.6 to 0.9, and exactly at that time when He I emission takes place (extended from 0.85 to 1.25).
 |
Fig. 4 Change of the helium and iron line emissions with phase. |
 |
Fig. 5 Radial velocities of absorption and emission components of Ca I, Fe I and Ni I lines. |
Radial velocity (in km s-1) of absorption and emission metallic lines
Since the Fe I emissions are very unusual, and they appear before the high excitation emission lines, their obvious presence at earlier phases than He I is important in analyzing where the Fe I emission originates. Fe I emissions show a reversed P-Cygni profile structure rather than a P-Cygni structure, which is shown by hydrogen. This can be very important in modeling the shock that appears during rising light.
It is important to stress again that Fe II emission appears at a different phase from Fe I. As follows from Fig. 4, at phases just after maximum light the region of the Fe I line formation is shock-wave-free. When the next shock front is forming near the φ ≈ 0.7, emission in the lines of the low excitation appears (Fe I, as well as Ti I, Ba II, etc, see Fig. 6). These emissions indicate an the upward motion in the stellar atmosphere, and it is obviously produced in the hot gas behind the shock front. As the shock front propagates into the upper atmosphere, the absorption lines become doubled (probably separated by the emission peak, phases approximately 0–0.1). Blueshifted absorption is from cooling gas moving upward, and the redshifted component is produced by gas in the atmosphere that has started to fall down. During the successive phase, the shock wave does not affect the layers of “metallic” absorption line formation.
 |
Fig. 6 Ti I and Ba II emissions in W Vir spectra at different phases. |
For the emission lines of neutral species the first question to be investigated is their origin. There are three possibilities: thermal excitation, recombination, and selective excitation by strong resonance lines. Selective excitation results in a few strong lines and is excluded by the presence of many Fe I lines with a wide variety of upper levels and roughly similar intensities. For a complex atom such as Fe I quantitative calculations of emission line intensities are extremely complicated due to the large number of levels, some of which are meta-stable, making it essential to consider departures from local thermodynamic equilibrium (LTE) in the populations. The extremely simple calculation that follows show that recombination is unlikely to be important and thus that thermal excitation dominates. We simply compare two lines of Fe I at 6421.35 Å (z3P°, g = 2) and 6430.85 Å (y5D°, g = 4). Their upper levels are 4.21 and 4.11 eV respectively above the ground state. The statistical weights favor the 6430 Å line by 2/1 which compensates for the difference in transition probability to make their predicted strengths almost the same. In thermal equilibrium they would be almost equally populated. Their equivalent widths are almost the same, 35 and 34 mÅ, as would be expected in thermal equilibrium. For the recombination rates we turn to the work of Nahar et al. (1997). In their Table 2 we examine their entries for 1000 K since Fe will be dominantly ionized at 10 000 K and inactive at 100 K. The recombination rate to the y5D° state is one of the largest in the table. Recombination to the z3P° was not included by Nahar et al. because the ground state of Fe II is a sextet thus greatly reducing recombination to triplets. This may be partially compensated by the large number of triplet states in Fe I from which cascades may contribute to the population of the upper state of the 6421 Å line (Bautista, priv. comm.). Since we are excluding cascades in this simplified calculation we expect the ratio of 6430/6421 to be substantial, but the lines are of equal intensity. Hence we favor thermal over recombination as the preferred mode of emission.
5. Predicting the phase of Fe I emission
Modelling the physical conditions behind a shock to reproduce the observed emission of Fe I is very complicated. One of us (ABF) has calculated the following series of approximate models which explains the appearance of weak Fe I lines in emission at the early phases at which they are observed. Since the emission lines of Fe I are due to thermal excitation, as noted above, we need only deal with one line. The other Fe I lines should appear according to their excitation energies and transition probabilities. The line we have selected is 6569.23 Å of multiplet 1253. It appears close to Hα.
For this analysis we used our W Vir-type hydrodynamical model presented here in the modeling section. In this pulsating model the shocks are generated as intrinsic solution of the radiative hydrodynamics. The atmosphere of the model has about 70 mass zones (this number varies from phase to phase because of displacement of the photosphere level with pulsation). It is sufficient to follow the full shock propagation and for the line profile analysis.
For our Fe I line analysis we have used 4 phases from 0.59 to 1.0. During this period the shock amplitude increases from 40 km s-1 to about 80 km s-1 as it propagates to the surface. At phase 0.59 the shock first can be detected in the model just above the photosphere and at optical depth 1.4, and it induces a blue-shifted Fe I emission component of intensity 1.017, where the continuum flux from the photosphere is 1.0. A red-shifted absorption component of 5% is also present. At phase 0.65 the shock grows in amplitude and induces a maximum (blue-shifted) emission with intensity 1.04. The optical depth of the shock is then 0.30. No significant absorption is present; i.e. the red-shifted absorption line has disappeared. By phase 0.70 no significant emission is present in the line as the shock has reached optical depth 0.01. The extended atmosphere cannot produce any emission in Fe I as the shock continues its way to the higher levels. At phase 1.0, maximum light, no emission is present, while the optical depth in the absorption line core is 0.0001.
These calculations show that a weak emission is to be expected at the observed phases. The reason that it had not been observed by Sanford, Abt and others (including one of us, GW) was the relatively low signal-to-noise (S/N) achievable with photographic plates as compared with modern CCD detectors. Only if the S/N is about 100 can emission lines that rise a few percent above the continuum be reliably recognized.
6. A qualitative model
Qualitatively, we can characterize the dynamics of the atmosphere of the star W Vir (Fig. 7) by the passage, sometimes simultaneously, of two main shock waves. The first shock (which can be formed from the merging of several waves as shown for instance by Fokin & Gillet 1997), has higher intensity and rises into the atmosphere. It is due to the κ-mechanism. The second shock is the consequence of the ballistic motion of the atmosphere. When the atmosphere falls during the ballistic movement, it creates a wave that is rapidly becoming a shock. According to the observations, the intensity of the latter seems to be high enough to generate emission in addition to ionization.
 |
Fig. 7 Hypothetical scheme of the W Vir atmosphere and envelope. Two shocks are indicated: the main shock that amounts in the atmosphere, and the secondary shock which is falling on the star. The absorption components of the hydrogen line located at zero speed (N4 component, see Fig. 13 for designations), and redshifted (N2 component) are expected to be formed within the envelope and the upper atmosphere, respectively. The UV flux comes mainly from nearby hot stars of W Virginis. |
6.1. The main forward shock
Fokin & Gillet (1997) have shown that the main forward shock would be produced by the opacity mechanisms on H and He atoms producing pulsations. In fact, the shock associated to the H-opacity mechanism has a higher intensity than that based on the He-opacity. During the beginning of their propagation in the lower atmosphere, they merge into a single shock, hereafter called as a “main shock”. Fokin, Gillet & Breitfellener (1996) have obtained similar result for classical Cepheids.
The main shock quickly gains a very high intensity. The He I 5875 Å line is observed in emission at the phase 0.827 (Lébre & Gillet 1992, hereafter LG92, their Fig. 6), and at the phase about 0.85 in this work (Fig. 4 and Fig. 8), and the He I 6678 Å line is in emission at 0.788 (LG92). This appearance occurs just after the new appearance of the Hα (0.537, LG92). As the radial velocity of helium increases rapidly to about phase 0.15 (30 km s-1 for He I 5875 Å, Fig. 9), this means that the shock accelerates during this phase interval. During the end of this acceleration phase, at maximum brightness, the emission in the line He I 6678 Å seems to show a P-Cygni profile (LG92, Fig. 7, phase 0.003). However, this is certainly not a real P-Cygni profile, but a blend due to the appearance of the Fe I absorption line at 6677.99 Å.
 |
Fig. 8 The behavior of the 5876 Å He I line profile. |
 |
Fig. 9 Radial velocity of the 5876 Å He I line components. |
If the layer of formation of an absorption line is sufficiently thick and if it is crossed by a shock wave, then it is possible to observe a doubling of the line profile. This mechanism was first explained by Schwarzschild (1953). The Schwarzschild mechanism is the temporal sequence followed by the intensity of the red and blue components of a double absorption line close to the maximum light, when the shock wave propagates through the photosphere. The red component appears first alone, followed by the double absorption profile (the red is first weaker). Then, when the shock reaches the higher part of the atmosphere, the red component presents a deeper intensity and finally, when the shock is far away, only the red component is visible.Thus the observation of such a temporal sequence would definitely point towards the shock stratification as the origin of the double absorption lines.
At the phases between 0.8 and 0.3, the absorption lines of Na I D1 and D2 show a well marked doubling (Fig. 10) without any emission. This phenomenon indicates that the sodium layer is crossed by the main shock wave. The phenomenon of doubling seems to be observed in the Paschen line at 8750 A between 0.006 and 0.270 phases (Fig. 11), but never in the weaker metal lines.
 |
Fig. 10 The Na I D1,D2 lines including the interstellar component. |
 |
Fig. 11 The Paschen line doubling. |
6.2. The infalling layers/shock collision
When the atmosphere of a star is very extended (often called an envelope), the region of formation of a spectral line occupies a large volume whose thickness may be equal to the photospheric radius. In this case, the shape of the profile of the line is completely different from that typically observed in a star, where the thickness of the atmosphere does not exceed approximately 10% of the photospheric radius. Thus, as in the case of the giant star W Vir, in which an envelope is radially expanding, the shape of the line profile is the well-known profile of the P-Cygni type (Mihalas 1978).
In fact, the dynamics of the atmosphere of W Vir is not a simple radial expansion at a constant velocity. As already calculated by Fokin (1991), depending on the phase of pulsation, the lower part of the atmosphere can have an upward movement while the upper atmosphere descends ballistically (see details below in the section about the hydrodynamical model). If the envelope is very extended and if the intensity of the main shock wave is rising high, then the relative speed of ballistic return movement can become large in its final phase. Thus, during the infall phase, the collision of the upper atmospheric layers with deeper ones i.e., with the main shock, begins before the minimum of the radius and ends later. This is consistent with the fact that the inverse P-Cygni profiles of Ti I, Fe I and Ba II lines (Figs. 1, 2, 6) are observed approximately between phases 0.6–0.9. In addition, this infalling motion does not seem to reach a sufficiently high intensity to induce Hα emission.
In the stellar rest frame, the radial velocity of the emission of an inverse P-Cygni profile should be close to zero (Mihalas 1978). This is what we see in Fig. 5, where radial velocities of emission and absorption features of the Ca I, Fe I, Ni I metallic lines are shown. As one can see from Fig. 5, the heliocentric radial velocity of emission components is close to the stellar rest frame velocity (–66.2 km s-1).
LG92 indicated that there is an inverse Schwarzschild (1953) mechanism in the phase interval 0.509-0.653. Given the complexity of the movement of the atmosphere during the ballistic falling toward the center of star, the reverse split absorption profile is not clearly visible, but only the “red” absorption component is developed. However, this type of reverse mechanism is plausible.
A bump appears in the light curve of some RR Lyr stars just before the minimum brightness (see for instance Gillet & Crowe 1988). This mechanism has been previously detected in the theoretical hydrodynamic model of RR Lyrae (Hill 1972). This bump is interpreted as the consequence of a shock occurring simultaneously with the collision between the upper and lower layers of the atmosphere during the end of the ballistic movement. In the case of W Vir, since there was no observational appearance of a bump in the light curve, we should not necessarily assume the creation of an infall shock wave.
6.3. The Hα profile
Hα line is one of the strongest lines in the visual region, being formed within the whole (extended) atmosphere. Its core is formed high in the outer atmosphere while the wings are formed deeper, so the variation of this line can provide important information about the dynamics of the lower and higher atmospheric regions, as well as about the circumstellar shell around the star. The Hα line may be affected by departures from LTE in the population of its lower level.
6.3.1. The very broad photospheric absorption component
Throughout the pulsation cycle, the Hα profile has a complex structure and consists of several components (Fig. 12) of different physical origin. Component radial velocities are shown in Fig. 13. As previously noted by Lébre & Gillet (1992), a strong wide absorption (about 20 Å, see their Fig. 4a at phase 0.156) dominates the profile in the phase interval 0.15–0.40. It should be noted that this broad absorption disappears when the new narrow emission appears in the center of absorption. The broad absorption component probably originates from the photosphere of the supergiant star, and consequently shows significant Stark wings around maximum of brightness.
 |
Fig. 12 Hα and Hδ profile variation. |
 |
Fig. 13 Radial velocities of the different components of Hα profile. |
6.3.2. The circumstellar absorption component
The N4 absorption, noted in Fig. 13, is always visible and has zero velocity in the rest frame of the star at any phase of pulsation. Its minimum is in general not far from the continuum level. It may be interpreted as a consequence of the presence of a circumstellar envelope with very low expansion rate, i.e. close to zero.
This absorption can also be formed before the previous shock which has reached very high atmospheric levels. Since we do not observe the P-Cygni profile, the hypothetical circumstellar envelope must have rather small radius.
6.3.3. The atmospheric absorption component
The second absorption component in the Hα emission (N2) has a weaker intensity and appears after the minimum brightness (phase 0.665, Fig. 3 of LG92); near the phase 0.213 it disappears. This absorption is redshifted and seems to undergo a slight acceleration (because its velocity shift increases up to 20 km s-1) from the maximum brightness. Accordingly, it may originate in the upper part of the atmosphere that falls on the star during the second phase of the ballistic movement. This is in agreement with the metallic profiles of inverse P-Cygni type.
6.3.4. The shock emission component
The main shock wave that rises into the atmosphere produces a broad emission line which includes all 5 components from N1 to N5 noted in Fig. 13. This line emission is produced directly in the wake of the radiative shock, i.e. just behind the viscous shock front. Compared to the photospheric radius, the line would form in a relatively narrow region. The N2 and N4 absorption components cause the observed mutilations in the broad emission. Finally, the latter is itself composed with the very broad photospheric absorption.
6.4. The Hδ profile
Hδ is less strong than Hα and is formed deeper in the atmosphere. We see (Fig. 12) that at some phases two absorption components can be noted, and the main component (the blue one) has a more or less constant Doppler velocity. This component seems to originate from the circumstellar envelope, like the main Hα absorption. However, the secondary absorption component, due to a shock passage, is not present after the light maximum. It seems that the Hδ line is less affected by the shock waves propagating in the atmosphere.
7. The hydrodynamic model
To study theoretically the atmospheric motions in W Vir, and first of all the circumstellar shell around it, we calculated the few hydrodynamic models of this star. For this, we applied our 1D radiative Lagrangian hydrocode that uses the variable Eddington factors to calculate the moments of the specific intensity (i.e. Fokin 1991). Here we present the results obtained with one representative model of a W Vir type star having the following parameters: M = 0.6 M⊙, L = 500 L⊙, opacity OPAL96 for Y = 0.7 and Z = 0.001. The model consists of 140 mass zones, its inner temperature was fixed at 2.836 × 10⁶ K, and its static photospheric radius is 27.8 R⊙, while pulsation period is about 14 days.
 |
Fig. 14 The nonlinear model for a W Vir type star. Upper diagram: the bolometric light curve. Lower diagram: temporal variations of the radii of different mass zones of the model. The zero point of the time scale in days is relative. |
Figure 14 represents the bolometric light curve and the variations with a time of the radii of different mass zones. The figure represents several pulsational cycles after about 400 cycles of pulsation. As is well-known, and as we see here, the pulsations are not strictly periodic, even in the photospheric region (in this diagram – around the boundary between the dark and clear (deeper) parts). The motions of the upper atmosphere and the photosphere have different behavior. Sometimes the atmospheric layers perform one pulsational cycle, while photospheric layers perform two cycles (as seen in RV Tau stars). This is explained by a large extension of the atmosphere due to pulsation. Indeed, while the mean radius of the photosphere is about 25–30 R⊙, the outer atmospheric layers extend nearly to 75 R⊙. According to the model, this provokes a kind of ballistic motion in the upper atmosphere, where the gas pressure and radiation pressure at some phases cannot resist the gravity. But this phenomenon also provokes another effect – a small variability of the Doppler velocity of the lines formed in the pre-shock region (e.g. the intrinsic Hα absorption line). Figure 15 illustrates this effect. In this figure we present the velocity profiles in our W Vir model from phase 0.4 to 0.8. This figure illustrates the propagation of a shock wave through the model atmosphere (the phase increases as the shock front propagates from the left to the right). One can see that the pre-shock velocity varies only by about 10 km s-1, while the post-shock velocity increases by about 50 km s-1 during these phases (and the shock amplitude increases comparably).
Unlike the visual light curve, the theoretical bolometric light curve presents at each pulsation period a well defined bump just before minimum radius. This phenomenon occurs when the main shock wave leaves the photosphere i.e., when the atmospheric layers complete their ballistic movement. At this point, their infall velocity reaches a maximum value. However, in the Figure showing the velocity variations for the atmospheric mass zones of W Vir, there was no emergence of a new thick black line indicating the presence of an infall shock wave. Indeed, when a shock occurs, the local rate of gas compression increases, so that thick black lines in this diagram represent the trajectories of the shock front through the mass grid. Only the main shock is marked from the bottom to the top of this very extended atmosphere. This means that only the collision between the upper layers dropping onto the photosphere and the shock wave can produce the light bump.
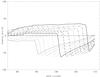 |
Fig. 15 The propagation of the shock wave in the atmosphere of the W Vir model. The velocity profiles are shown for about 40% of the period. See discussion in the text. |
Because of some known uncertainties in the stellar parameters (radius, mass, luminosity, opacity tables used) this theoretical model, however, should be considered only as an approximate one. Accordingly, some quantitative differences in the atmosphere dynamics are possible. Nevertheless, from the above analysis we conclude that W Vir itself may well have a circumstellar envelope, or at least a very extended and dense atmosphere, which allows the formation of a complicated system of shock waves affecting the line shapes, and producing absorption and emission components.
8. Conclusion
Our conclusions are based, firstly, on the spectral line analysis, and secondly, on the nonlinear pulsation model with an extended atmosphere. Also, we keep in mind the fact that the shock wave always propagates (in the mass scale) outwards, and its amplitude increases with its height, as the density of the gas decreases (until other dissipation mechanisms kill the shock).
The analysis of the variability of the faint metallic (photospheric) lines indicates that the inner parts of the W Vir atmosphere exhibit radial pulsations with characteristic Doppler shifts of the absorption cores. The observed velocity amplitudes (about 50 km s-1) correspond to the amplitudes revealed by the hydrodynamical model.
The main shock wave (forward shock), spreading upwards, is the dynamical result of the pulsation mechanism. The intensity of the shock may be sufficient to produce the helium line emission. This is quite rare in radially pulsating stars, but is also seen in RR Lyrae stars (Preston 2009). During the end of the ballistic motion, the collision between the atmospheric layers infalling on the photosphere and the main upward shock wave may occur.
Stronger lines, which in average are formed higher in the atmosphere, show the doubling of their absorption cores without emission. This phenomenon can be explained by the classical Schwarzschild doubling effect due to the shock wave propagation. When the shock amplitude is not yet strong enough to create a hot wake it is not sufficient to produce emission, but is able to produce the Doppler splitting.
Hα, one of the strongest lines, whose core is formed in the highest atmosphere layers and circumstellar envelope, demonstrates the (permanent) emission, and at the same time, the two absorption components. The complicated emission structure of the Balmer lines can be due to the interplay between the post-shock gas heating in the stellar atmosphere, and the circumstellar envelope emission of the P-Cygni type. The blue absorption component can be due to the self-absorption in the circumstellar envelope that explains its almost constant Doppler velocity. The red absorption component is probably due to the absorption in the falling stellar atmosphere before the shock, and its slow Doppler velocity variation can be explained by our theoretical result discussed in the previous section.
Although our model cannot represent in detail a real star with an extended circumstellar envelope, we nevertheless believe that our results suggest that W Vir consists of two parts: an inner one is a pulsating star with periodic shocks penetrating into the upper atmosphere, and an outer one – a circumstellar envelope. The interaction of the main shock wave with infalling layers can explain observed variable peculiarities in the spectral lines.
Acknowledgments
We thank Suzanne Hawley, the Director of the Apache Point Observatory, for arranging the telescope assignments to cover the critical phases of W Vir. We thank Manuel Bautista for some very helpful suggestions regarding recombination of Fe I, Steve Shore for the valuable comments, and anonymous referee for the reviewing our paper. VVK and SMA kindly acknowledge financial support from the Kenilworth Fund obtained through CRDF. ABF acknowledges the financial support from the grants: RFBR 08-02-00469-a, 08-02-00738-a, and the Presidium RAS grant “Origin and evolution of stars and galaxies”. We also thank L.A. Willson for her helpful comments.
References
- Abt, H.A. 1954, ApJS, 1, 63 [NASA ADS] [CrossRef] [Google Scholar]
- Fokin, A. B. 1991, MNRAS, 250, 258 [NASA ADS] [CrossRef] [Google Scholar]
- Fokin, A. B., & Gillet, D. 1997, A&A, 325, 1013 [NASA ADS] [Google Scholar]
- Fokin, A. B., Gillet, D., & Breitfellener, M. G. 1996, A&A, 307, 503 [NASA ADS] [Google Scholar]
- Gillet, D., & Crowe, R. A. 1988, A&A, 199, 242 [NASA ADS] [Google Scholar]
- Hill, S. J. 1972, ApJ, 178, 793 [NASA ADS] [CrossRef] [Google Scholar]
- Joy, A. H. 1938, ApJ, 86, 363 [Google Scholar]
- Lébre, A., & Gillet, D. 1992, A&A, 255, 221 [NASA ADS] [Google Scholar]
- McSaveney, J. A., Pollard, K. R., & Cottrell, P. L. 2005, MNRAS, 362, 331 [NASA ADS] [CrossRef] [Google Scholar]
- Mihalas, D. 1978, Stellar Atmospheres (San Francisco: W. H. Freeman and Co.,) [Google Scholar]
- Nahar, S. N., Bautista, M. A., & Pradhan, A. K. 1997, ApJ, 479, 497 [NASA ADS] [CrossRef] [Google Scholar]
- Preston, G. W. 2009, A&A, 507, 1621 [NASA ADS] [CrossRef] [EDP Sciences] [Google Scholar]
- Raga, A., Wallerstein, G., & Oke, J. B. 1989, ApJ, 347, 1107 [NASA ADS] [CrossRef] [Google Scholar]
- Sanford, R. F. 1953, Trans. IAU, 8, 809 [Google Scholar]
- Schwarzschild, M. 1953, Trans. IAU, 8, 811 [Google Scholar]
- Templeton, M. R., & Henden, A. A. 2007, AJ, 134, 1999 [NASA ADS] [CrossRef] [Google Scholar]
- Wallerstein, G. 1959, ApJ, 130, 560 [NASA ADS] [CrossRef] [Google Scholar]
- Whitney, C. A. 1956a, AnAp, 19, 34 [Google Scholar]
- Whitney, C. A. 1956b, AnAp, 19, 142 [Google Scholar]
- Whitney, C. A., & Scalafuris, A. 1963, ApJ, 138, 200 [NASA ADS] [CrossRef] [Google Scholar]
All Tables
All Figures
|
Fig. 1 Emissions in different lines. |
| In the text | |
|
Fig. 2 Emissions in Fe I lines 6393.6 Å and 6400.0 Å. |
| In the text | |
|
Fig. 3 Fe II emission. |
| In the text | |
|
Fig. 4 Change of the helium and iron line emissions with phase. |
| In the text | |
|
Fig. 5 Radial velocities of absorption and emission components of Ca I, Fe I and Ni I lines. |
| In the text | |
|
Fig. 6 Ti I and Ba II emissions in W Vir spectra at different phases. |
| In the text | |
|
Fig. 7 Hypothetical scheme of the W Vir atmosphere and envelope. Two shocks are indicated: the main shock that amounts in the atmosphere, and the secondary shock which is falling on the star. The absorption components of the hydrogen line located at zero speed (N4 component, see Fig. 13 for designations), and redshifted (N2 component) are expected to be formed within the envelope and the upper atmosphere, respectively. The UV flux comes mainly from nearby hot stars of W Virginis. |
| In the text | |
|
Fig. 8 The behavior of the 5876 Å He I line profile. |
| In the text | |
|
Fig. 9 Radial velocity of the 5876 Å He I line components. |
| In the text | |
|
Fig. 10 The Na I D1,D2 lines including the interstellar component. |
| In the text | |
|
Fig. 11 The Paschen line doubling. |
| In the text | |
|
Fig. 12 Hα and Hδ profile variation. |
| In the text | |
|
Fig. 13 Radial velocities of the different components of Hα profile. |
| In the text | |
|
Fig. 14 The nonlinear model for a W Vir type star. Upper diagram: the bolometric light curve. Lower diagram: temporal variations of the radii of different mass zones of the model. The zero point of the time scale in days is relative. |
| In the text | |
|
Fig. 15 The propagation of the shock wave in the atmosphere of the W Vir model. The velocity profiles are shown for about 40% of the period. See discussion in the text. |
| In the text | |
Current usage metrics show cumulative count of Article Views (full-text article views including HTML views, PDF and ePub downloads, according to the available data) and Abstracts Views on Vision4Press platform.
Data correspond to usage on the plateform after 2015. The current usage metrics is available 48-96 hours after online publication and is updated daily on week days.
Initial download of the metrics may take a while.