Free Access
Fig. 14
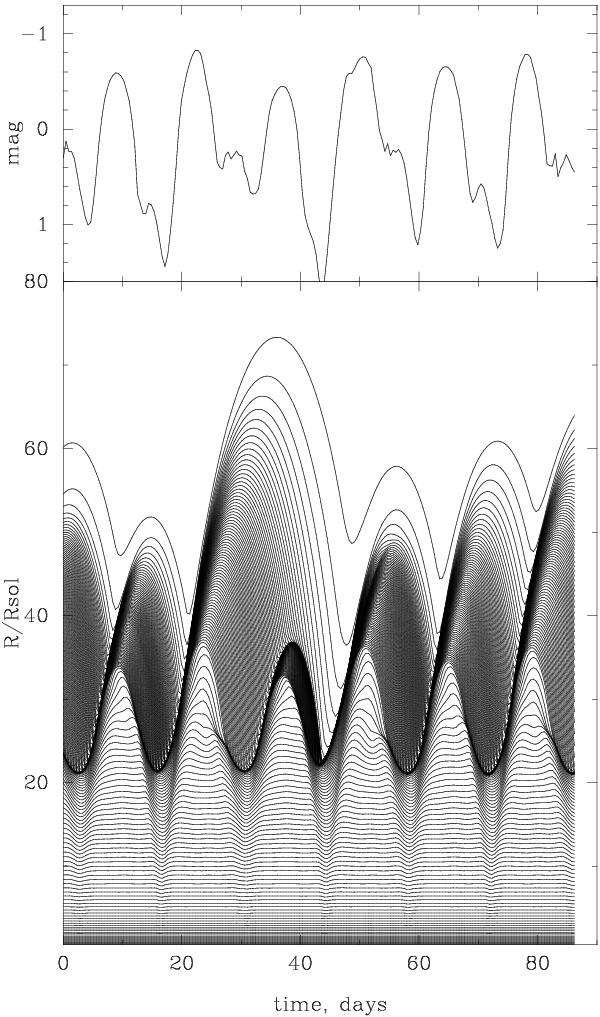
The nonlinear model for a W Vir type star. Upper diagram: the bolometric light curve. Lower diagram: temporal variations of the radii of different mass zones of the model. The zero point of the time scale in days is relative.
Current usage metrics show cumulative count of Article Views (full-text article views including HTML views, PDF and ePub downloads, according to the available data) and Abstracts Views on Vision4Press platform.
Data correspond to usage on the plateform after 2015. The current usage metrics is available 48-96 hours after online publication and is updated daily on week days.
Initial download of the metrics may take a while.