Fig. 2
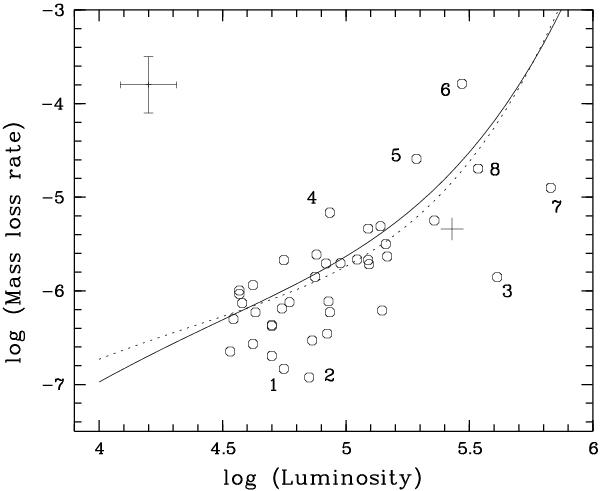
Comparison of de Jager rate (plotted for Teff = 3500 K and 4000 K) with mass-loss rates of 39 RSGs listed in Table 1. The mass-loss rates are based on the study of dust and obtained with Jura’s formula. The labels indicate a few wellknown RSGs as follows: 1: α Ori; 2: α Sco, 3: μ Cep, 4: S Per, 5: PZ Cas, 6: VY CMa, 7: EV Car (at 4.2 kpc); 8: VX Sgr. The small cross represents EV Car if a smaller distance of 2.5 kpc is adopted. At the upper left corner, error bars represent uncertainties of ±30 percent in luminosity, and a factor of ±2 in Ṁ.
Current usage metrics show cumulative count of Article Views (full-text article views including HTML views, PDF and ePub downloads, according to the available data) and Abstracts Views on Vision4Press platform.
Data correspond to usage on the plateform after 2015. The current usage metrics is available 48-96 hours after online publication and is updated daily on week days.
Initial download of the metrics may take a while.