| Issue |
A&A
Volume 525, January 2011
|
|
|---|---|---|
| Article Number | A91 | |
| Number of page(s) | 18 | |
| Section | Extragalactic astronomy | |
| DOI | https://doi.org/10.1051/0004-6361/201014714 | |
| Published online | 03 December 2010 | |
New H2O masers in Seyfert and FIR bright galaxies
IV. Interferometric follow-ups⋆
1
INAF-Osservatorio Astronomico di Cagliari,
Loc. Poggio dei Pini, Strada 54,
09012
Capoterra ( CA),
Italy
e-mail: This email address is being protected from spambots. You need JavaScript enabled to view it.
2
Max-Planck-Insitut für Radioastronomie,
Auf dem Hügel 69,
53121
Bonn,
Germany
3
Argelander-Institut für Astronomie der Universität Bonn,
Auf dem Hügel 71,
53121
Bonn,
Germany
Received:
1
April
2010
Accepted:
23
August
2010
Abstract
Context. Very luminous extragalactic water masers, the megamasers, are associated with active galactic nuclei (AGN) in galaxies characterized by accretion disks, radio jets, and nuclear outflows. Weaker masers, the kilomasers, seem to be related mostly to star formation activity, although the possibility exists that some of these sources may belong to the weak tail of the AGN maser distribution.
Aims. It is particularly important to accurately locate the water maser emission to reveal its origin and shed light on extragalactic star-forming activity or to elucidate the highly obscured central regions of galaxies.
Methods. We performed interferometric observations of three galaxies, NGC 3556, Arp 299, and NGC 4151, where water emission was found. Statistical tools were used to study the relation between OH and H2O maser emission in galaxies.
Results. The maser in NGC 3556 is associated with a compact radio continuum source that is most likely a supernova remnant or radio supernova. In Arp 299, the luminous water maser has been decomposed in three main emitting regions associated with the nuclear regions of the two main galaxies of the system, NGC 3690 and IC 694, and the region of overlap. In NGC 4151, only one of the two previously observed maser components has been tentatively detected. This feature, if real, is associated with the galaxy’s central region. The only galaxy, so far, where luminous maser emission from two maser species, OH and H2O, has been confidently detected is Arp 299. Weaker masers from these two species instead coexist in a number of objects. A search for emission from both maser species in a larger number of galaxies is, however, needed to assess these last two results better.
Key words: masers / galaxies: active / galaxies: nuclei / galaxies: starburst / radio lines: galaxies
Table 5 is only available in electronic form at http://www.aanda.org
Member of the International Max Planck Research School (IMPRS) for Astronomy and Astrophysics at the Universities of Bonn and Cologne.
© ESO, 2010
1. Introduction
While there is unanimous consent that the most luminous H2O masers are related to the nuclear activity of their host galaxies (accretion disks, nuclear jets, or outflows), the origins of the weaker extragalactic masers, i.e. the “kilomasers”, are still a matter of debate. Unlike the megamasers, the observed luminosities (LH2O < 10 L⊙) of kilomasers can be explained by the superposition of several galactic W49N-like or even weaker sources. Furthermore, most of the known kilomasers are associated with particularly active star-forming regions clearly offset from the nucleus of their parent galaxy (e.g., M 33, Churchwell et al. 1977). This has led to the belief that kilomasers and megamasers may constitute two distinct classes of extragalactic H2O masers. Most of the former are related to star formation similar to, although typically brighter than, the galactic masers, while the latter are thought to be exclusively powered by the nuclear activity of active galactic nuclei (AGN). The kilomaser sources associated with the active galactic nuclei of M 51 (Hagiwara et al. 2001b) and of a few more H2O masers of lower luminosity in the inner parsecs of NGC 4051 (Hagiwara et al. 2003), NGC 520 (Castangia et al. 2008), and NGC 3620 (Surcis et al. 2009) hint at the possibility that some kilomasers could also be related to nuclear activity, providing the low-luminosity tail of the more powerful megamasers.
To date, beyond the Magellanic Clouds, the presence of 32 kilomasers has been reported from 24 galaxies (see Table 3). The maser emission from 16 of these galaxies has not yet been studied at high resolution so that it is impossible to draw definite conclusions on its nature. This and the impact such measurements have on pinpointing spots of vigorous star formation or elucidating properties of nearby AGN has motivated extended searches for more such masers, as well as interferometric follow-ups, to determine their origin.
With this goal in mind, we performed Very Large Array (VLA1) observations of the kilomaser source NGC 3556, detected in our far infrared (FIR) sample comprised of all galaxies with IRAS Point Source 100 μm flux density >50 Jy and Dec. > –30° (Henkel et al. 2005, hereafter HPT). In addition, we used the VLA to observe the megamaser in Arp 299, which is part of the same sample, and it appears to arise from more than one spot (Tarchi et al. 2007b). Finally, we also present interferometric data from NGC 4151, a Seyfert galaxy hosting a kilomaser with unusual features.
In Sects. 2 and 3, we describe the observations and results, respectively. Section 4 associates the detected masers with either star formation or AGN activity and analyses statistically the extragalactic H2O and OH (kilo)masers known to date. Main conclusions are summarized in Sect. 5. The present work is the last in a series of papers (Henkel et al. 2005; Castangia et al. 2008; Surcis et al. 2009) that report searches for water maser emission in complete FIR-flux based samples of galaxies, highlight new water maser line detections, and present detailed maps of their surroundings.
2. Observations
All galaxies were observed in spectral line mode, in the 616 → 523 transition of ortho-H2O (rest frequency 22.23508 GHz).
2.1. NGC 3556
NGC 3556 was observed with the VLA in two hybrid configurations, CnB on September 28, 2002 and DnA on January 25, 2006. In both cases, observations were made by employing a single band of width 6.25 MHz centered on the velocity of the maser feature detected with Effelsberg (740 km s-1; HPT). The observing band was subdivided into 128 channels each of width 48.8 kHz, which corresponds to ~0.7 km s-1. The flux density scale was determined in both observing runs by measuring the nonvariable source 3C 286, with an adopted flux density of 2.54 Jy, as calculated by the NRAO’s Astronomical Image Processing System (AIPS) task SETJY using the revised (by Perley) scale of Baars et al. (1977). The phase calibrator was 11282+59252, whose flux density was estimated to be 0.56 ± 0.01 Jy and 0.65 ± 0.01 Jy in the two runs, respectively. We also used 3C 286 to determine the bandpass corrections. On January 5, 2008, NGC 3556 was also observed at 1.4 GHz by the Multi-Element Radio Linked Interferometer Network (MERLIN2) in wide-field continuum mode for a total on-source integration time of 18 h. The sources 3C 286 and 1055+567 were used as flux and phase calibrators, respectively.
2.2. Arp 299
Water vapor in Arp 299 was observed on September 19, 2004 and April 9, 2007 with the VLA
in its A and D configurations, respectively. A frequency setup with two 25 MHz
intermediate frequency bands (“IFs”) centered on local standard of rest velocities of
VLSR = 2900 and 3200 km s-1 was used. The IFs
were overlapped in frequency to minimize the effect of band-edge roll-off. Each IF covered
~340 kms-1 with a resolution of ~20 kms-1. For both datasets,
the flux density and bandpass calibration was performed by using 3C 286 (2.56 Jy) and the
phase calibration was derived from observations of the point source 11282+59252
(0.53 ± 0.01 for the A and 0.30 ± 0.01 Jy for the D array, respectively). Radio
continuum maps were produced using the (few) line-free channels. For the A-array data, the
restoring beam was 0 1 × 01,
and the rms noise was 0.5 mJy/beam/chan and 0.25 mJy/beam for the cube and the continuum
maps, respectively. The noise was higher than the expected thermal noise, likely because
of poor weather during the observations. For the D-array data, the restoring beam was
49 × 40
and the rms noise was 0.25 mJy/beam/chan and 0.1 mJy/beam for individual spectral channels
and the continuum maps, respectively. Spectral line 22-GHz single-dish observations of the
water maser in Arp 299 were also performed with the 100-m Effelsberg radio telescope in
November 2005 by pointing at the three main centers of activity in the system (see
Sect. 3.2) and in April 5, 2007 (only four days before the VLA D-array measurements) with
a single pointing midway between the three aforementioned locations.
1 × 01,
and the rms noise was 0.5 mJy/beam/chan and 0.25 mJy/beam for the cube and the continuum
maps, respectively. The noise was higher than the expected thermal noise, likely because
of poor weather during the observations. For the D-array data, the restoring beam was
49 × 40
and the rms noise was 0.25 mJy/beam/chan and 0.1 mJy/beam for individual spectral channels
and the continuum maps, respectively. Spectral line 22-GHz single-dish observations of the
water maser in Arp 299 were also performed with the 100-m Effelsberg radio telescope in
November 2005 by pointing at the three main centers of activity in the system (see
Sect. 3.2) and in April 5, 2007 (only four days before the VLA D-array measurements) with
a single pointing midway between the three aforementioned locations.
2.3. NGC 4151
NGC 4151 was observed with the VLA in its DnA hybrid configuration on January 25, 2006. Observations were made using two 3.125-MHz IFs centered at the velocity of the two maser features detected with the GBT (692 and 1127 km s-1, respectively; Braatz et al. 2004). Each IF was subdivided into 128 channels that provide a channel spacing of 24.4 kHz corresponding to ~0.33 km s-1. The flux density scale and bandpass corrections were determined by using 3C 286 (2.54 Jy). The phase calibration was derived from observations of 11470+39586 (0.88 ± 0.01 Jy).
2.4. Data reduction and position accuracy
The data reduction was made using AIPS. All datasets were calibrated in the standard way. The radio continuum emission was subtracted from the spectral line data using AIPS task UVLSF, which fits a straight line to the visibilities of the line-free channels and then subtracts it from the uv dataset. This task also provides the fitted baseline as an uv dataset that was used to create continuum maps. Each individual dataset was Fourier-transformed using natural weighting and then deconvolved utilizing the CLEAN algorithm (Högbom 1974). Details of the observations and of the interferometric maps are summarized in Table 1.
The accuracy on absolute positions in a map due to statistical errors can be estimated
using the synthesized beam size divided by the signal-to-noise ratios. For details on this
derivation see, e.g., Hagiwara et al. (2001a). For
our observations taken in the VLA D and CnB-array configurations, given their relatively
coarse resolution, the statistical errors dominate, so they are representative of the
positional accuracy for the maps produced. For the VLA A and DnA-array maps, the
positional uncertainties are dominated by the error due to the different position of the
phase calibrator w.r.t. that of the target galaxies. The nominally estimated error for
absolute positions in this case is 0 1.
Since in our measurements we used the “fast switching” technique and since errors can be
divided by the signal-to-noise ratio (see above), this value can be taken as a safe upper
limit (see, e.g., Tarchi et al. 2007a). Coordinates
of the maser peaks in our VLA maps and associated positional errors are reported in
Table 2.
The relative positions between line and continuum peak positions derived from the same
data is only limited by the signal-to-noise ratios since the uncertainty caused by the
different position of the calibrator w.r.t. that of the target galaxy affects both
positions in the same way and cancels out. As a result, for our data we estimate the error
on relative positions to be  ,
where θ denotes the restored beam size of the map in use, and l and c
refer to line and continuum emission (for details, see also Tarchi et al. 2007a, and references therein). When the line and peak
positions are instead derived by different datasets, the final accuracy can be estimated
by the quadratic sum of the errors on the absolute positions in the two maps.
,
where θ denotes the restored beam size of the map in use, and l and c
refer to line and continuum emission (for details, see also Tarchi et al. 2007a, and references therein). When the line and peak
positions are instead derived by different datasets, the final accuracy can be estimated
by the quadratic sum of the errors on the absolute positions in the two maps.
Interferometric maps.
Parameters of the maser lines observed with the VLA.
3. Results
3.1. NGC 3556
NGC 3556 is a nearby3 (D ~ 12 Mpc, 1″ is equivalent to ~60 pc) edge-on spiral galaxy with an FIR luminosity similar to that of the Milky Way (LFIR ~ 1010 L⊙). The presence of a conspicuous radio halo (Irwin et al. 1999), prominent Hi loops interpreted as expanding supershells (King & Irwin 1997), and extraplanar diffuse X-ray emission (Wang et al. 2003a) all indicate that NGC 3556 is undergoing an intense disk-halo interaction. At high resolution, the radio continuum emission is resolved into a number of discrete components, which form a partial ring around the Hikinematic center (Irwin et al. 2000; hereafter ISE). Although a radio core is absent, Chandra X-ray observation revealed an ultraluminous X-ray source close to the Hi kinematic center and the 2 μm peak, which has a power law spectrum typical of an AGN (Wang et al. 2003a). A significant amount of dense molecular gas is present in the galaxy, as proved by 12CO and HCN observations (Gao & Solomon 2004). Water maser emission has been detected, for the first time, with Effelsberg, in March 2002. The detection spectrum and three more single-dish spectra at subsequent epochs are shown in HPT (their Fig. 5).
In our VLA observations, we detected H2O water maser emission at VLSR ~ 738 km s-1 with a peak flux density for the CnB and DnA arrays of ~13 and 27 mJy, respectively (Fig. 1). A Gaussian fit to the spectra indicates that the full width to half maximum (FWHM) of the maser feature is 8 ± 2 and 3.7 ± 0.3 km s-1, yielding similar values for the isotropic maser luminosity for the two arrays, 0.29 and 0.28 L⊙ (see Table 2).
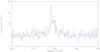 |
Fig. 1 The VLA CnB-array (blue solid line) and DnA-array (black solid line) water maser spectra of NGC 3556 taken in 2002 and 2006, respectively. Both spectra have a channel spacing of 0.7 km s-1. |
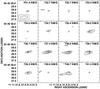 |
Fig. 2 Channel maps of the H2O maser emission in NGC 3556 observed with the VLA CnB array. Contour levels are –3, 3, 3.5, 4 × 4 mJy beam-1 (1σ rms = 4 mJy beam-1). The cross indicates the position of the line peak. |
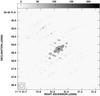 |
Fig. 3 Gray scale and contour plot of the total integrated intensity of the maser emission in NGC 3556 observed with the VLA DnA array. Integration was performed over the velocity interval 720–760 km s-1. Contours: –1, 1, 2, 4 × 25 mJy/beam/km s-1. (1σ rms = 0.4 mJy/beam/km s-1). |
Comparing the VLA CnB spectrum observed on September 28, 2002, with the spectrum taken with Effelsberg one day before (HPT; upper panel of their Fig. 5), we note that the peak flux density of the maser line observed by the VLA is less than half of what was observed with Effelsberg. The intensity of the VLA DnA spectrum is, instead, closer to the single-dish measurements. For all observations, taken with either Effelsberg or the VLA, the VLSR velocity and linewidth of the maser features are consistent with each other.
Figures 2 and 3 show contour plots of those channels, which exhibit significant line emission and a moment-0 map (i.e. a map of the velocity-integrated intensity) in the velocity range 720–760 km s-1 obtained from the two CnB and DnA VLA datasets, respectively. These maps indicate that the maser emission is slightly resolved both in space and velocity.
We fitted a two-dimensional Gaussian to the brightness distribution of the source in the
VLA CnB channel map showing the most intense emission (from 737.4 to
738.7 km s-1 in Fig. 2, left panel) and
find that the bulk of the emission arises from a spot of beam deconvolved dimensions of
~07 × 02
at position
αJ2000 = 11h11m31 46
and δJ2000 = 55°40′288.
Tentative maser emission also seems to be present in a spot ~70 pc east of the main
feature at a velocity VLSR = 740.7 km s-1 and
position
αJ2000 = 11h11m3160
and δJ2000 = 55°40′285
(Fig. 2). Additional weak spots might be present
both in the CnB and DnA channel maps. These, however, are faint, arise from isolated
channels and may be spurious.
46
and δJ2000 = 55°40′288.
Tentative maser emission also seems to be present in a spot ~70 pc east of the main
feature at a velocity VLSR = 740.7 km s-1 and
position
αJ2000 = 11h11m3160
and δJ2000 = 55°40′285
(Fig. 2). Additional weak spots might be present
both in the CnB and DnA channel maps. These, however, are faint, arise from isolated
channels and may be spurious.
Since VLA broad band 22 GHz data were not available, we produced CnB and DnA-array VLA continuum maps from the line-free channels. In both maps, no continuum emission was detected above a 1σ rms noise of ~0.5 mJy beam-1. This result is consistent with the 1.4-GHz flux densities reported by ISE for the compact sources in the nuclear region of NGC 3556. Even the strongest source(s) of ISE remain(s) undetected in our maps indicating a nonthermal origin of the emission.
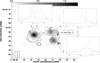 |
Fig. 4 Big panel: moment-zero map (gray scale) of the water maser emission in the Arp299 system observed by the VLA in its D configuration superimposed on the 22-GHz uniformly-weighted VLA D-array radio continuum image (contours) of the system produced by using the line-free channels in the maser data cube. Contour levels are –1, 1, 2, 4, 8, 16, 32, 64 × 0.5 mJy beam-1 (1σ rms = 0.15 mJy beam-1). Small panels: for each center of maser emission within the Arp299 system, spectra from Effelsberg (dashed line), VLA D-array (solid line), and VLA A-array (dash-dotted line) are shown, with a channel spacing of 17, 20, and 20 km s-1, respectively. |
3.2. Arp 299
The extremely luminous infrared galaxy Arp 299 (Mkn 171)4 is a merging system located at a distance of ~42 Mpc (Casoli et al. 1999). It is composed of three main regions of activity: the two galaxies IC 694 (A) and NGC 3690 (B; resolved at infrared and radio wavelengths into two components, B1 and B2)5, and the individual concentrations (C and C′) at the interface where IC 694 and NGC 3690 overlap (for a description of the system and for the nomenclature used, see, e.g., Neff et al. 2004; their Fig. 2). The system is rich in molecular gas (Casoli et al. 1999) and displays OH megamaser activity with an isotropic luminosity of ~240 L⊙ (Baan 1985) apparently tracing a rotating disk in IC 694 (Baan & Haschick 1990; hereafter BH90). The presence of such a flattened rotating structure in IC 694 was subsequently also invoked by Polatidis & Aalto (2001) to explain its atomic (Hi) and molecular (CO) gas velocity distribution. In March 2002, strong water megamaser emission was detected in the merging system Arp 299, with a total isotropic luminosity of ~200 L⊙ (HPT). Later, preliminary results of our VLA A-array observations were reported in Tarchi et al. (2007b). They show that the water maser emission in the system is produced mainly by two spots associated with the innermost regions of IC 694 and NGC 3690. Tentative emission was seen in the overlapping region.
In a more thorough data reduction of the VLA A-array data, the scenario described in
Tarchi et al. (2007b) is confirmed with higher
confidence (see Fig. 4). Luminous maser emission is
detected at two locations with coordinates
αJ2000 = 11h28m3365;
δJ2000 = 58°33′468
and αJ2000
= 11h28m3099;
δJ2000 = 58°33′407,
corresponding to the two brightest centers of activity in the system labeled A and B1 by
Neff et al. (2004). The maser features have peak
velocities of 2996 and 3112 km s-1. Our recent VLA D-array data confirm
emission in locations and velocities consistent, within the accuracies, with those
resulting from the previously taken higher resolution VLA data. In particular, the
tentative emission detected with the A-array in the overlap region is convincingly
confirmed. Most of the emission originates from a bright spot (~4 mJy), peaks at a
velocity of 3158 km s-1, and has a position,
αJ2000 = 11h28m3135;
δJ2000 = 58°33′498,
coincident with the source C’ of Neff et al.
(2004). In Fig. 4 (large panel), we show the
moment-zero map of the water maser emission in Arp299 observed by the VLA in its D
configuration superposed on the 22-GHz uniformly-weighted VLA D-array radio continuum
image produced by using the line-free channels in the maser data cube. The spectra of the
maser emitting regions observed with Effelsberg and the VLA, in its A and D
configurations, are plotted in the smaller panels of the same figure. Location, line peak
velocity, flux density, linewidth, and isotropic luminosity of the maser features are
given in Table 2. Weaker emission (~1.8 mJy) in
the overlap region is also detected at a position of
αJ2000 = 11h28m3065;
δJ2000 = 58°33′493
with a peak velocity of 3142 km s-1 and a line width of
~25 km s-1. The location is coincident with the source C of Neff et al. (2004). For the sake of clarity, this
feature is not included as a panel in Fig. 4, while
it is shown, using a narrower, more-suitable y-axis scale, in Fig. 5.
3.3. NGC 4151
NGC 4151 is a grand-design, weakly barred spiral located at 13.3 Mpc (Braatz et al. 2004), which is known to host an active galactic nucleus (AGN). Although it is often classified as a type 1.5 Seyfert (Osterbrock & Koski 1976), its broad optical emission lines are variable and sometimes give a type 2 Seyfert spectrum (Sergeev et al. 2001). The equivalent hydrogen column density, inferred from the X-ray spectrum toward the nucleus, is also similar to what is found in typical Seyfert 2 galaxies (NH ~ 1.5 × 1023 cm-2, Wang et al. 2010). Radio observations of the nucleus show a linear radio structure (jet) approximately 3 .′′5 (220 pc) in length, at a position angle (PA) 77° (Wilson & Ulvestad 1982). Carral et al. (1990) identified six discrete knots along the jet at 15 GHz, the strongest of which (peak flux density: 12.5 mJy/beam) has a flat spectral index that is consistent with the synchrotron self absorption associated with an AGN. Higher angular resolution VLBA and phased VLA observations at 1.4 GHz resolved the strongest knot into several components that appear to be associated with changes in the orientation of a faint highly collimated jet (diameter ≤1.4 pc), as it interacts with small gas clouds (Mundell et al. 2003). The identification of one of these components with the AGN is still uncertain. In Braatz et al. (2004), the detection of water maser emission with an isotropic luminosity of 0.7 L⊙ was reported. The maser emission is primarily confined to two very narrow components, one at 692.4 km s-1 and the other at 1126.6 km s-1, blushifted and redshifted, respectively, w.r.t. the systemic velocity of the galaxy, 995 km s-1. For a channel spacing of 0.33 km s-1, Gaussian fits of the emission lines yielded peak flux densities and linewidths of 36 and 53 mJy, and 1.2 and 1.5 km s-1 (FWHM), respectively.
Our VLA DnA spectra (Fig. 6, upper-right panel)
indicate, in the first IF, the tentative presence of a narrow single-channel line at
695.6 km s-1 with a peak flux density of ~30 mJy for a channel spacing of
0.33 km s-1, while no emission is detected in the second IF. The position of
the putative emission feature is
αJ2000 = 12h10m3258
and δJ2000 = 39°24′211.
Assuming an upper limit for the uncertainty in the peak velocity of about one channel,
0.33 km s-1, this feature, if real, is still offset by ~3 km s-1
from the one detected by Braatz et al. (2004).
However, it may well belong to a group of variable features emitted in a narrow range of
velocities. The indication of strong intrinsic variability in the NGC 4151 maser was
indeed reported by Braatz et al. (2004).
The radio continuum contour map produced by using the line-free channels of the data cube
is shown in the lower left hand panel of Fig. 6. A
slightly-resolved source is detected at 22 GHz with position
αJ2000 = 12h10m3258 ± 001
and δJ2000 = 39°24′211 ± 01
and a peak flux density of ~15 mJy that is coincident in position, within the limits of
accuracy (~007;
see Sect. 2.4 and Table 1), both with the maser spot
and with the putative AGN of NGC 4151 (e.g. Carral et al.
1990; Mundell et al. 2003; Ulvestad et al. 2005).
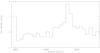 |
Fig. 5 Weak water maser feature detected in the Arp299 system observed by the VLA in its D configuration at the position of the western peak of the C + C’-complex, labeled C (Neff et al. 2004, Fig. 4). The channel spacing is 20 km s-1. |
4. Discussion
4.1. Individual galaxies
4.1.1. NGC 3556
Since no continuum emission was detected in our 22-GHz map of NGC 3556, we use maps
published in the literature. The main maser spot is possibly associated with the
strongest compact source (hereafter referred to as CS-3556) shown in the 1.4-GHz VLA map
of ISE (Fig. 7, lower panel) although with a
relatively large uncertainty (the relative position error is of
01).
Thus, the origin of the maser emission is closely related to the nature (AGN or star
formation region) of CS-3556 and to the possible presence of an AGN.
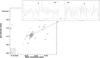 |
Fig. 6 Lower-left panel: naturally-weighted VLA DnA-array 22 GHz radio continuum contour map of NGC 4151 produced by using the line-free channels in the maser data cube. Contours: –1, 1, 2, 3, 4, 5 × 1.7 mJy (1σ rms = 0.6 mJy beam-1). Upper panels: 22 GHz spectra from the IF1 (left) and IF2 (right) VLA DnA-array data cube. The two IFs sample the velocity ranges where narrow water maser lines (their velocities are marked by arrows) were detected with the GBT by Braatz et al. (2004). The systemic velocity of the galaxy is 995 km s-1. |
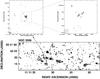 |
Fig. 7 Lower large panel: a VLA A-array map of the continuum emission of NGC 3556 at 20 cm (ISE). The asterisk identifies the optical center. The large black cross indicates the Hikinematic center given by King & Irwin (1997) with the relative error (dashed-line circle). The smaller blue cross near the upper right corner of the green dashed circle denotes the 2 μm peak. The pink triangle marks the position of Chandra source 35. The position of the water maser is indicated by the red X-mark. The multipointed star in the lower right edge indicates a position where some supernovae have been detected (see ISE). Upper left panel: naturally weighted contour image of the only compact nuclear radio continuum source, among those of ISE, detected in NGC 3556 at 1.4 GHz by MERLIN. Contours: –2.5, 2.5, 3, 3.5, 4, 4.5, 5 × 50 μJy/beam (1σ rms = 0.05 mJy beam-1). Upper right panel: uniformly-weighted 1.4 GHz MERLIN contour image of the compact source. The star marks the water maser position. Contours: –3, 3, 3.5, 4 × 40 μJy/beam (1σ rms = 0.04 mJy beam-1). |
While spectral index information on CS-3556 was not available, ISE concluded that the radio emission has a nonthermal origin and is due to a collection (~10) of supernova remnants (SNRs) that cannot be resolved by the synthesized beam. Although not mentioned by ISE, another possible explanation is that CS-3556 may actually be an individual bright SNR or radio supernova, like those found in M 82. Wang et al. (2003a) found an AGN candidate among the discrete X-ray sources detected with Chandra (hereafter labeled X-35). However, its position offset from both the Hikinematic center and the 2 μm peak (14″ ≡ 815 pc and 8″ ≡ 465 pc, respectively; see Fig. 7) and X-ray luminosity (~1039 erg s-1 in the 0.5–10 keV band), just at the lower limit of the Eddington luminosity, indicates a nature for X-35 that is more consistent with a luminous X-ray binary than with a putative AGN. A clear signature of an AGN is then missing. Furthermore, the source CS-3556 is confidently offset from X-35 and the Hipeak (by 11″ and 8″, respectively), and, in particular, from the 2 μm peak (the position which is known with an accuracy of ~1″) by 5″. Most likely, CS-3556 is indeed a group of SNRs as proposed by ISE, or an isolated particularly bright SNR like those found in the nuclear regions of other starburst galaxies, rather than the galactic nucleus. That CS-3556 belongs to a chain of compact radio sources (Fig. 7) apparently tracing a partial ring or arm-like structure similar to those found in other galaxies and related to quasi-contemporary star formation triggered by a propagating density wave reinforces our conclusion.
Very recently, we obtained a deep 1.4-GHz MERLIN observation where we detected one continuum source in the nuclear region of NGC 3556 confidently associated with CS-3556. The source is relatively weak (with a flux density of 0.25 mJy) and extended in the naturally weighted image (Fig. 7, upper-left panel). When the source is imaged using uniform weighting, hence at a slightly higher resolution, the emission splits into two spots labeled CS-3556/A and CS-3556/B (Fig. 7, upper-right panel), most likely hinting at being composed of two galactic SNR-like sources, as suggested by ISE, or compact Hii (CHii) regions. Future spectral index studies of these two sources may differentiate the thermal or nonthermal nature of the emission. In either case, this confirms the association between the maser and CS-3556 with higher position accuracy and, in particular, with CS-3556/A, the southwestern of the two continuum sources. Then, if our scenario is correct, the confident association of the H2O maser with CS-3556/A indicates that the kilomaser in NGC 3556 is related to star formation as in the majority of the weak extragalactic masers.
The 50% flux density decrease observed between the Effelsberg spectrum on September 27, 2002 (30 mJy; HPT, their Fig. 3) and the VLA CnB profile (Fig. 1), obtained only a day later, hardly explicable in terms of variability, suggests that the maser feature observed with Effelsberg is a sum of a number of “weak” maser spots, which are resolved by the higher resolution of the VLA. Indeed, the channel maps (Fig. 2) indicate that the emission arises from more than one spot, even though only the strongest component is luminous enough to be confidently detected and to be present in more than one channel. The possibility that we are observing a collection of weak masers, the brightest of which has a luminosity of ~0.3 L⊙, once more favors the association with star formation activity.
Interestingly, the velocity of the maser line (VLSR = 738 km s-1) is redshifed by ~40 km s-1 w.r.t. the systemic velocity of the galaxy (Vsys = 699 km s-1, NED; VLSR − VHEL = + 5.90 km s-1). However, the maser line is located where the gas belonging to the Hidisk has velocities of about 680 km s-1, which is blueshifted w.r.t. the systemic ones (King & Irwin 1997). Therefore, the discrepancy between the observed and expected velocity is of the order of 60 km s-1. When excluding an association with the galactic nucleus, as discussed before, this discrepancy can be explained by invoking gas motions in clouds (see, e.g. Surcis et al. 2009, for NGC 3256) or assuming that the masing gas belongs to a counter-rotating structure, an expanding supernova shell, or a starburst wind or outflow (see also Brunthaler et al. 2009, for a detailed analysis with respect to NGC 253). With the data presently available for NGC 3556, it is impossible to distinguish between these possibilities.
4.1.2. Arp 299
Simultaneous detection of luminous water maser emission in different regions of Arp 299 represents a unique case among the LIRG/ULIRG class of objects. Therefore, it provides an excellent opportunity to study origin and excitation mechanisms that form water masers in interacting galaxies and an important tool for understanding the entire Arp 299 merging system.
As previously reported (Sect. 3.2), one of the
three main maser spots detected in Arp 299 is coincident with the nuclear region of
IC 694. The higher spatial resolution map obtained from the VLA A-array indicates that
the position of the maser is offset of ~02
(≈40 pc at the distance of IC 694) to the northeast w.r.t. that of the nuclear radio
continuum peak at 8 GHz (Neff et al. 2004).
However, due to the relatively low signal-to-noise ratio of the VLA-A array
observations, this result requires further confirmation. Another masing spot is located
within a distance of 01
from the putative nucleus of NGC 3690 (Fig. 4).
Then, a significant fraction of the emission is located in the overlapping region (the
C + C’-complex), most of which is associated with the subcomponent labeled C’, although
weaker emission is present also at component C.
The velocities of the water masers are unusual when being compared with the Hi (BH90) and CO (Casoli et al. 1999) velocity fields. In particular, the H2O maser line associated with IC 694 should have a velocity around 3140 km s-1, while it is detected at ~2990 km s-1. The peak velocity (~3112 km s-1) of the maser feature associated with the nucleus of NGC 3690 is instead more consistent with, although slightly redshifted to, what is expected from other gas tracers at the same location (~3050 km s-1). Furthermore, more than one velocity component is present in the C+C’-complex.
The aforementioned discrepancies are, however, not surprising at all. The gas velocity field of Arp 299, both in its atomic and molecular component, is very complex and cannot be described by a composition of two independent, rotating disks representing the two main galaxies (e.g. BH90; Aalto et al. 1997). A simple picture to describe the behaviour of the Hi and OH gas in Arp 299 has been proposed by BH90 where all the higher velocity gas belongs to IC 694 and that at lower velocity is related to NGC 3690. In this scenario, gas from both galaxies reaches the other galaxy to produce the apparent anomalies in the velocity field. Furthermore, gas from NGC 3690 and IC 694 also have components in C and C’, respectively. While the maser found close to the nucleus of NGC 3690 can be safely associated with this galaxy, given its precise overlapping in position with the nuclear source and small difference in velocity, the maser apparently associated with IC 694, could instead be masing gas associated with the disk of NGC 3690, possibly amplifying emission from the nuclear (star-forming or AGN) region in IC 694. However, before drawing such a conclusion we should note that according to BH90 only the large scale velocity field is explained by the aforementioned simple model, while a closer look in front of the nuclear region of IC 694 shows several velocity components. In Fig. 8, we show a modified version of their figure (Fig. 11 in BH90) where such a description is summarized and where we have included the position and velocity of our maser to determine with which of the velocity components it can be associated. The proximity to the expanding structure in IC 694 introduced by BH90, makes an association between the water maser and this dynamical component likely. This structure, represented in both the HI absorption and OH maser emission data, is possibly a slab of material related to outflow phenomena due to superwinds produced in the AGN or regions with particularly enhanced star formation activity. Strong Hi and OH outflows have been detected in several edge-on systems that share similarities to IC 694. We therefore think that the 2990 km s-1 feature is masing gas associated with IC 694.
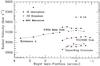 |
Fig. 8 A modified version of Fig. 11 of BH90 showing the Hi and OH velocity components along the major axis (at position angle of ~45°) near the nucleus of IC 694. The red “X” marks the position and velocity the water maser feature detected by us in IC 694. |
As already mentioned, our results can help determine the nature of the various objects constituting the Arp 299 system.
IC 694 The debate over the nature of A, the putative nucleus of IC 694, is ongoing. Based on the compact nature of the radio emission, some authors suggest there is an obscured AGN in A (e.g. Sargent & Scoville 1991; Lonsdale et al. 1992). From a comparison between the X-ray luminosity of A and B1, Ballo et al. (2004) deduce that both IC 694 and NGC 3690 host AGN activity. According to them, such X-ray intensity could not be accounted for by star formation alone. However, Zezas et al. (2003) argued against this interpretation. Many other authors indicate that the nuclear region of IC 694 is exhibiting particularly strong and compact nuclear star formation activity with no evidence for an AGN (e.g. Alonso-Herrero et al. 2009 and references therein).
One of the questions that arise when looking at the three water maser spectra of IC 694 (that of Effelsberg, VLA-A, and VLA-D; Fig. 4, upper-left inserted panel) is the difference in their peak fluxes. Variability can indeed be invoked to justify these flux changes. This seems to be supported by the comparison of the single-dish spectra taken with the 100-m Effelsberg telescope in November 2005 and in April 2007 (only 4 days before the VLA D-array measurements) shown in Fig. 9, where the maser line associated with IC 694 seems to experience an increase in flux density. The intensity of the maser in NGC 3690 does not change much. Given, however, the different characteristics of the measurements (with the older observation being sensitive and pointing at the individual nuclei, while the more recent spectrum is noisier and targets a middle point in the system), the variability scenario should be taken with caution.
An alternative option may also be viable. The lower resolution spectra (the
November-2005 Effelsberg and VLA-D ones) have similar line flux densities and profiles.
The spectrum taken with the VLA A-array is instead quite different. Although (as
reported in Sect. 2) these observations were affected by bad weather that increased the
noise level, the 60% reduction in flux density w.r.t. to the other spectra has to be
considered as real. If the maser in IC 694 is associated with an AGN, as possibly
suggested by its large interferometric brightness, ranging from 8 to
28 L⊙ depending on the VLA array used, we would not
expect to resolve its emission, and hence, to significantly lose flux, when passing from
the D to the A array. If instead, the observed line is actually a collection of numerous
maser spots associated with the intense star formation activity known to be present in
IC 694 (e.g., Alonso-Herrero et al. 2009; and
Pérez-Torres et al. 2009), at the resolution of
the VLA A-array, we may start to resolve this group of spots. We could then be left with
only the stronger ones, while the weaker may be below the detection threshold. Similar
cases have been reported for a number of extragalactic kilomasers associated with star
formation (Tarchi et al. 2002a, for NGC 2146;
Surcis et al. 2009, for NGC 3256; present work,
for NGC 3556). If this scenario is correct, the maser in IC 694 would be associated with
star formation rather than an AGN. An additional hint of the possible “star-forming”
nature of the maser is the 02
offset derived between the radio continuum peak in source A and the maser location (see
above). This, of course, does not provide a definite answer to the question of AGN
activity, especially since OH (mega)maser emission was found in source A (and only there
in the entire system). Very recently, Ulvestad
(2009) has reported on a study of the radio luminosities of the 25 continuum
compact sources detected in the nuclear region of IC 694 with sensitive VLBI
observations, concluding that the possibility that one of these sources is associated
with an AGN cannot be ruled out.
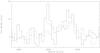 |
Fig. 9 Water maser spectra taken with the 100-m Effelsberg telescope on Nov. 2005, pointing towards putative nuclei of IC 694 (dash-dotted line) and NGC 3690 (dashed line), and on April 5, 2007 (4 days before the VLA D-array measurements) on a single pointing at intermediate distance between the nuclei (solid line). In this case, the Effelsberg 40″ beam covers the entire Arp 299 system. |
For IC 694, we also compared the positions of the emission produced by the two maser
species. The VLA study by BH90 indicates that the OH emission is coincident with the
central peak of radio emission in IC 694, but the emission is extended. Furthermore,
OH pumping requires that the molecular gas is located close to the nuclear FIR region.
The spatial coincidence between the OH maser and the radio continuum peak has also been
confirmed at higher resolution with MERLIN (Polatidis & Aalto 2000, 2001) and,
tentatively, with the EVN (Klöckner & Baan
2002). The location of the water maser emission is also very close to the
nuclear region although a small offset w.r.t. the radio continuum seems to be present
(see previous paragraphs). Since the OH maser absolute position is not reported in Polatidis & Aalto (2000), Polatidis & Aalto (2001), and Klöckner & Baan (2002) and the alignment
accuracy between our VLA A-array map and that of BH90 is limited to
~02,
the possible coincidence between the two masing regions cannot be ruled out. In any
case, our result provides first evidence of strong maser emission from both molecules.
NGC 3690 Several attempts have been made to unveil any AGN activity
within this galaxy. della Ceca et al. (2002),
Zezas et al. (2003), and Ballo et al. (2004) using X-ray observations, García-Marín et al. (2006) through optical measurements, and Gallais et al. (2004) and Alonso-Herrero et al. (2009) with studies at infrared wavelengths, all
strongly support the hypothesis that B1 is the true nucleus of NGC 3690 hosting an AGN.
The detection of our water maser confirms this conclusion. The maser spot’s location is
coincident, within an accuracy of 01
(≈20 pc at a 42 Mpc distance), with the putative nucleus of the galaxy (B1).
Furthermore, water masers found in association with AGN typically have luminosities
>10 L⊙ and are forming a
collection of spots closely grouped around the nucleus, thus only seen as a single
feature on the angular scale of the VLA. The maser in NGC 3690 follows these
characteristics, has an isotropic luminosity of ~20 L⊙,
is spatially unresolved with the VLA A-array (100 mas resolution), and does not show any
order of magnitude variations in its overall integrated flux density. The presence of an
AGN in NGC 3690 is also considered possible by very recent radio continuum VLBI
observations performed by Ulvestad (2009).
C+C’-complex Another truly relevant result of our VLA observations is the detection of emission in the C+C’-complex. Given its noticeable properties, e.g. the high molecular mass and the conspicuous NIR emission, it has been suggested that this complex was a satellite galaxy taking part in the merger event (e.g. Casoli et al. 1989; Telesco et al. 1985; Nakagawa et al. 1989). However, BH90 concluded that it is not necessary to invoke a third galaxy in the system to justify the region C’s properties. Our finding, the presence of H2O kilomaser emission associated with the C-complex both in the subcomponents C’ and, at a weaker level, C, favors vigorous star formation and does not provide any strong hint of an active nuclear core. The youth and intensity of this burst, as deduced from its exceptionally strong 22-GHz emission and the presence of a substantial population of (ultra-)compact/ultradense (UC/UD) Hii regions (e.g., Alonso-Herrero et al. 2009), is remarkable. A similar case has recently been reported by Darling et al. (2008) for the Antennae system (NGC 4038/4039), where water kilomaser emission of ~8 L⊙ has been detected in the “interaction region” (IAR) offset from the nuclei of the two galaxies taking part in the merger. The emission arises from one spatially unresolved spot separated in velocity into two distinct features. The water kilomaser emission is similarly luminous in the Antennae and the C-complex of Arp 299. This further corroborates similar physical conditions, as already suggested by common properties like enhanced star formation, strong (N)IR emission, and the presence of several UD Hii regions (Darling et al. 2008).
The Arp 299 and Antennae merging systems themselves are, however, quite different. Assuming a distance of 42 Mpc for Arp 299 (see Sect. 3.2) and of 21 Mpc for the Antennae (Darling et al. 2008), the IR luminosity of the former (LIR ≈5 × 10¹¹ L⊙; Alonso-Herrero et al. 2000) is 5 times that of the latter (LIR ≈ 1011 L⊙; Sanders et al. 2003). Furthermore, the linear distance between the two galactic nuclei in the systems (IC 694/NGC 3690 and NGC 4038/4039) derived from interferometric radio maps are 5 (Neff et al. 2004) and 7 kpc (Neff & Ulvestad 2000), respectively. In general, the merger in Arp 299 is more advanced than in the Antennae (e.g. Sargent & Scoville 1991; Schulz et al. 2007). Since galaxy mergers are a very efficient means of fueling AGN (e.g., Combes 2001), the different stage of the mergers may account for the AGN activity in Arp 299 that is not detected in the Antennae. At the same time, since advanced mergers may result in burying AGN with high concentrations of obscuring material, the large nuclear obscuration would also favor very luminous maser emission. This would further explain our water maser detection in the nuclei of the two galaxies of Arp 299. No maser emission has been reported so far in either of the two nuclei of the Antennae. Indeed, the nucleus of NGC 4038 has been searched for water maser emission down to a luminosity detection threshold of ~1 L⊙ (HPT), while there has been no mention in the literature of a similar search in the nucleus of NGC 4039.
4.1.3. NGC 4151
The maser line tentatively detected in IF1 comes from an unresolved spot coincident in position with the continuum peak detected in the line-free channel map. From its location this peak can be identified as the sub-component E of the radio knot C4 (labels are from Mundell et al. 2003, and references therein). While the debate on the exact location of the AGN in NGC 4151 is still going on, the most recent publications indicate that D, and in particular subcomponent D3, is the most promising candidate, based on the location and distribution of the Hi absorption, the structure of the radio continuum (Mundell et al. 2003), and the high brightness temperature of the source (Ulvestad et al. 2005). According to Mundell et al. (2003), source E is instead the brightest knot of the radio counterjet that is located behind the Hi absorbing layer. If this is the case, the kilomaser in NGC 4151 may be produced by an interaction between the radio jet and the interstellar medium (ISM). Indeed, indications of such an interaction between the radio jet and the clumpy ISM of NGC 4151 are reported by Mundell et al. (2003). NGC 4151 may then represent the second case of a nuclear kilomaser, just after M 51 (Hagiwara et al. 2001b). Similarities do exist between the two cases like the presence of redshifted and blushifted emission in the single-dish spectra, although the maser features in M 51 are broader than those in NGC 4151, hence more consistent with the linewidths found for the megamaser sources associated with radio jets. The strength, narrowness, and strong variability of the maser features favor instead an association with star formation activity that, with the present data, cannot be excluded.
4.2. Kilomasers revisited
In Table 3, we have summarized relevant results related to extragalactic H2O kilomasers, in the context of their association with AGN, SNRs, or Hiiregions. We have a total of 32 kilomaser sources in 24 galaxies. Half (16) of these 32 kilomasers (labeled “SF”) are confidently associated with star formation activity being either clearly off-nuclear or, like NGC 253 H2O–1 and NGC 3556, coincident in position with sources in the nuclear region produced by star formation phenomena. For the 8 sources labeled with “SF(?)”, the association with star formation is instead (only) the most likely option since it is based on qualitative considerations on the nuclear position of the maser emission, the absence of clear evidence of AGN activity in the host galaxy and/or the shape of the maser line profile (see e.g., Castangia et al. (2008), for NGC 520, Surcis et al. (2009), for NGC 3620).
For other 4 kilomasers (in NGC 2273, NGC 4051, NGC 4151, and NGC 4293, labeled with “AGN?”) the origin of the maser emission has been instead plausibly related to AGN activity (although, also in this case, a validation is necessary), mainly because the nucleus of the galaxy hosting the maser emission is an AGN and/or the maser line profile resembles more that of the AGN-associated ones (see, e.g., Hagiwara et al. 2003, for NGC 4051; the present work for NGC 4151). Among the remaining sources, for 2 of them (in NGC 1106 and NGC 4527) both associations, AGN or star formation, are equally plausible (Braatz & Gugliucci 2008), while for the kilomaser in NGC 6300 the nature of the maser emission, so far, has never been discussed. Noticeably, the only kilomaser ever reported that is undoubtedly associated with an AGN (labeled with “AGN”) and, in particular, with the nuclear radio jet, is the one in M 51 (Hagiwara et al. 2001b).
The question arises therefore wether there is a family of nuclear, AGN-associated, kilomasers. Are there intrinsic differences in the host galaxy that, in the absence of studies at high (<1″) spatial resolution, can allow us to distinguish between kilomasers associated with star formation and those associated with AGN activity? A possible suggestion is briefly introduced by Zhang et al. (2006) and, more recently, by Greenhill et al. (2008) in the broader framework of the association between maser phenomena and nuclear X-ray column density. Their general conclusion was that the distributions of kilomasers and megamasers are different, with the latter associated with galaxies with higher nuclear column densities. Half of the megamasers in their sample are Compton-thick, viz. NH > 1024 cm-2. In particular, Zhang et al. (2006) found that, for kilomasers, two groups were apparently present, one with nuclear column densities of 1021−22 cm-2 and another with nuclear column densities of >1023.3 cm-2. Furthermore, it was put forward that the few nuclear kilomasers have an average column density that is indistinguishable from those of the entire megamaser sample. In Fig. 10, we show an updated plot from Zhang et al. (2006) (their Fig. 6a), with the number of H2O kilomasers as a function of nuclear column density derived from X-ray spectroscopy for all 19 kilomaser galaxies (Zhang et al. 2006: 12 galaxies) for which such information was available. From Fig. 10, it is clear that the lower average nuclear column density of kilomasers compared to that of megamasers is confirmed, while there is no evidence of the “bimodal” distribution of nuclear column densities within kilomasers. The value for the nuclear column densities is a continuous function that spans a range of values between 1021.08 cm-2 (M 82) and 1024.75 cm-2 (M 51; although the values for NGC 6300 and NGC 2273 are only lower limits). Indeed, as qualitatively suggested by Zhang et al. (2006), the kilomasers associated, or most likely associated, with AGN activity are found in galaxies with higher nuclear column densities (1023 cm-2 < NH < 1025 cm-2), different from those with a star-forming origin, which are found in galaxies with nuclear column densities <1023 cm-2. The only exception is represented by the maser in NGC 253 that, despite being quite confidently associated with star formation (Hofner et al. 2006; Brunthaler et al. 2009), is found in a galaxy with relatively high column density (2 × 1023 cm-2). According to this view, kilomasers like those in NGC 6300 or NGC 2273, for which the nature of the emission is still uncertain, could be speculatively associated with AGN activity because of the high nuclear column density. Interestingly, very recent results indicate that the latter maser source is indeed associated with an accretion disk around the central engine of the galaxy (Greene et al. 2010). Unfortunately, for five kilomaser galaxies (NGC 1106, NGC 3359, NGC 3620, NGC 4293, and NGC 4527), no information on column densities could be obtained. Future observations of these targets by XMM − Newton and Chandra would be desirable.
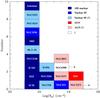 |
Fig. 10 Histogram showing the number of H2O kilomaser galaxies as a function of their nuclear column density derived from X-ray spectroscopy. Due to the higher angular resolution, Chandra data are taken whenever possible (with the exception of NGC 4051 for which the XMM-derived column density value was preferred to that of Chandra because of the large uncertainties reported). Otherwise, the most recent measurements are used (see Table 4). The arrows for NGC 2273 and NGC 6300 indicate lower limits to the column densities. Each color indicates the association of the water maser emission with either star formation or AGN activity, and the degree of confidence in such an association. |
If our picture is correct, then the presence of a family of nuclear kilomasers associated with AGN activity is possible. One of the distinguishing characteristics may indeed be the higher obscuration present around nuclear engines that we infer from the nuclear X-ray column densities. Since our discussion only involves nuclear X-ray column densities, we cannot (and do not want to) investigate the relation between the kilomaser phenomenon and the X-ray absorption in off-nuclear kilomaser regions. However, these detections originate from single-dish searches for water maser emission that, for more distant objects, cover the entire body of the target galaxy or, for the nearer ones, most of the galactic disk extent, including the nuclear regions. Hence, the lack of nuclear maser emission in these galaxies having relatively low nuclear X-ray column densities reinforces our supposition.
According to our results, the typical distinction between two classes of extragalactic water maser sources, kilo- and mega-masers, based on a sharp isotropic luminosity edge traditionally set to 10 L⊙ should, in our opinion, be revised. While it is quite safe to state that the upper end of the water maser luminosity function is populated exclusively by maser sources associated with AGN activity, a mixture of masers associated with either star formation or AGN activity seems to be present at lower luminosities. In particular, since maser isotropic luminosities, especially for those AGN-related, may be strongly dependent on orientation effects, the existence of relatively low-luminous AGN-related masers may be justified. If necessary, a more proper way to distinguish between water masers should thus be related to the origin of the emission associated to either one of the aforementioned forms of activity.
Properties of extragalactic 22 GHz H2O kilomasers and their potential association with AGN, SNR, or Hiiregions.
Nuclear X-ray absorbing column densities of extragalactic H2O kilomaser galaxies*. This table is an updated version of that presented by Zhang et al. (2006).
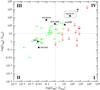 |
Fig. 11 OH vs. H2O maser luminosity including all sources where masers from both species have been searched for. Green arrows represent the galaxies hosting only H2O maser emission, red arrows are those sources hosting only OH maser emission, and filled triangles are galaxies where both H2O and OH masers have been detected. Upper limits for the undetected maser species are set to the detection luminosity threshold (3σ) of the survey in that maser transition. The dashed lines indicate the separation between kilomaser and megamaser regimes as found in the literature (for H2O masers, see Sect. 1; for OH masers, see Henkel & Wilson 1990). The question mark associated with the position in the plot of UGC 5101 is explained in Sect. 4.3. |
4.3. On the H2O/OH relation
Table 5 lists all sources where maser emission from either H2O or OH, or both, has so far been reported in the literature6. Out of the 173 sources of Table 5, 85 host water maser emission, and 94 have OH maser emission detected. Six sources overlap between the two groups since they show maser emission from both molecular species. Unfortunately, not all sources that host maser emission from either one of the maser species have also been searched for emission from the other molecule. In Fig. 11, we show a plot with the water and OH maser isotropic luminosities (measured values for detections or 3σ upper limits in case of non detections), mainly derived from single-dish measurements, for those galaxies (51) that were searched for maser emission from both species. The plot can be summarized as follows:
-
32 galaxies show only water maser emission;
-
13 galaxies show only OH maser emission;
-
no OH megamaser also shows H2O kilomaser emission (quadrant I);
-
6 sources show maser emission from both molecules. In particular, the two well-known starburst galaxies NGC 253 and M 82 show kilomaser emission from H2O and OH (quadrant II), the two water megamaser galaxies NGC 3079 and NGC 1068 also host an OH kilomaser (quadrant III), and Arp 299 and UGC 5101 (doubts, however, on the result for this galaxy are described later in this section) show megamaser emission from both molecules (quadrant IV).
Being aware that statistics may be affected by the different and/or insufficient sensitivities of maser searches and by possible variations in the maser features, we try in the following to provide a possible interpretation of these results. Despite our warning on using a strict isotropic luminosity threshold to infer the origin of water maser emission (see previous section), in the following for consistency with past works (see e.g. Surcis et al. 2009, and references therein), we necessarily have to use 10 and 1 L⊙ as isotropic luminosities to distinguish between the kilomaser and megamaser regime for H2O and OH, respectively. According to this classification, 95% (89/94) are OH megamasers in all the galaxies where OH maser emission has been found. For water masers, 73% (62/85) are megamasers. Figure 11 indicates that, for the subsample of galaxies searched for both maser species, most of the OH detections (14 out of 19) are megamasers (with NGC 1068 and NGC 4355 having luminosities very close to the upper limit for kilomasers). Since very luminous masers are always found in AGN, the distances for the OH maser galaxy subsample is, on average, higher than for the H2O masers, where a relatively lower number of megamaser sources (21 out of 39) are present. Due to the different average distance of the samples, the luminosity detection threshold is typically higher for water maser searches in OH-masing galaxies than for OH searches in H2O-maser hosts. This may partly justify the results for quadrants I to III: no OH megamaser with a detected H2O kilomaser but 4 OH kilomasers, indeed the closest four galaxies of the OH subsample, also detected in the water maser line. This suggests that weak masers from both species should indeed coexist in the same object (although possibly not at the very same location), similar to what happens in galactic star-forming regions. Possibly, only a selection effect of the sensitivity of the surveys has so far limited the number of detections of the contemporary presence of kilomasers from both species to a few.
In our study, only two galaxies show megamaser emission from both molecular species, Arp 299 and UGC 5101. However, the OH megamaser detection in UGC 5101 reported by Martin (1989) has never been confirmed, and doubts were raised by the non-detection obtained later by Baan et al. (1992). Without a confirmation of the OH megamaser line in UGC 5101, we consider the system Arp 299 as the only clear case with detected megamaser emission from both molecular species. But then, what is causing this apparent lack of “double” detections? To answer this question, a more systematic approach (parallel surveys to detect H2O maser emission in OH maser galaxies, and viceversa) and a more detailed study of the, so far, unique case, IC 694, are necessary.
5. Conclusions
From the results of our interferometric observations on three extragalactic water maser galaxies and by more extended studies of water (and OH) maser sources, we can draw the following main conclusions.
-
The kilomaser in NGC 3556 has a starformation origin associated with a compact radio continuumsource, possibly identified as a supernova remnant or radiosupernova.
-
The megamaser in Arp 299 originates in three distinct regions associated with the nuclear regions of the two merging galaxies, NGC 3690 and IC 694, and in their region of interaction.
-
Our study on Arp 299 confirms the likely presence of an AGN in the nucleus of NGC 3690. Without ruling out the possibility for AGN activity in IC 694, our outcome instead favors an association for the maser in this galaxy with an expanding structure possibly related to the extreme star formation activity taking place in the innermost region of the galaxy.
-
The kilomaser in NGC 4151 originates in the nuclear region. Its association with the AGN, known to be present in the galaxy; cannot, however, be confidently assessed because we only tentatively detect one of the two maser features in our maps. The known variability of the two line features is possibly the main cause of our partial detection.
-
Kilomasers are mostly associated with massive star formation, although a number of them are credibly related to low-luminosity AGN activity. The nuclear X-ray column density for the former type is typically lower than for the AGN-associated candidates, strengthening the possibility of there being two distinct classes. Given the low-luminosity of some of the maser sources associated with AGN, however, our study reinforces the conviction that a distinction between SF- and AGN-associated water masers based on a sharp isotropic luminosity threshold is not proper and instead requires case studies of individual systems to be assessed.
-
A thorough analysis of the interplay between extragalactic maser emission from H2O and OH is affected by how few objects were searched for both transitions. Nevertheless, our study indicates that, as expected, weaker maser emission from both molecular species can indeed be present in the same object, most likely because of the association of such emission with star formation processes. Only one case, that of Arp 299, is found to host megamaser emission from both molecules. This case indeed deserves to be studied in even more detail.
Online material
All galaxies known so far to host either H2O(standard font) or OH (italics) maser emission, or both (bold face).
The National Radio Astronomy Observatory (NRAO) is operated by Associated Universities, Inc., under a cooperative agreement with the National Science Foundation.
MERLIN is a National Facility operated by the University of Manchester at Jodrell Bank Observatory on behalf of STFC.
The distance is taken from King & Irwin (1997) and is derived from the radial velocity corrected for the anisotropy of the 3 K cosmic microwave background.
According to the NASA/IPAC Extragalactic Database (NED), the entire merger forms NGC 3690, while IC 694 is a less prominent galaxy 1′ to the northwest. Here we follow the more traditional nomenclature that is commonly used in the literature.
IR, radio, and X-ray observations all indicate that the putative nucleus of NGC 3690 is located at position B1. Source B2 is more prominent in the optical because it is less obscured than B1 at visible wavelengths and may be associated with a region vigorously forming massive stars (Alonso-Herrero et al. 2009, and references therein). Hereafter, we therefore consider B1 as the nucleus of NGC 3690.
Additional 50 unpublished galaxies, where 22 GHz water emission has been recently detected, are listed on the “Megamaser Cosmology project” homepage. However, no luminosity information has so far been reported, so these sources are not included in our list.
Acknowledgments
We wish to thank the referee for his/her comments on the manuscript. G.S. is supported by the Deutsche Forschungsgemeinschaft (DFG) through the Emmy Noether Reasearch grant VL 61/3-1. This research has made use of the NASA/IPAC Extragalactic Database (NED), which is operated by the Jet Propulsion Laboratory, Caltech, under contract with NASA. This research has also made use of the NASA’s Astrophysics Data System Abstract Service (ADS).
References
- Aalto, S., Radford, S. J. E., Scoville, N. Z., & Sargent, A. I. 1997, ApJ, 475, L107 [NASA ADS] [CrossRef] [Google Scholar]
- Alonso-Herrero, A., Rieke, G. H., Rieke, M. J., & Scoville, N. Z. 2000, ApJ, 532, 845 [NASA ADS] [CrossRef] [Google Scholar]
- Alonso-Herrero, A., Rieke, G. H., Colina, L., et al. 2009, ApJ, 697, 660 [NASA ADS] [CrossRef] [Google Scholar]
- Baan, W. A. 1985, Nature, 315, 26 [NASA ADS] [CrossRef] [Google Scholar]
- Baan, W. A., & Haschick, A. 1990, ApJ, 364, 65 (BH90) [NASA ADS] [CrossRef] [Google Scholar]
- Baan, W. A., Haschick, A., & Henkel, C. 1992, AJ, 103, 728 [NASA ADS] [CrossRef] [Google Scholar]
- Baars, J. W. M., Genzel, R., Pauliny-Toth, I. I. K., & Witzel, A. 1977, A&A, 61, 99 [NASA ADS] [Google Scholar]
- Ballo, L., Braito, V., Della Ceca, R., et al. 2004, ApJ, 600, 634 [NASA ADS] [CrossRef] [Google Scholar]
- Bassani, L., Dadina, M., Maiolino, R., et al. 1999, ApJS, 121, 473 [NASA ADS] [CrossRef] [Google Scholar]
- Bauer, F. E., & Brandt, W. N. 2004, ApJ, 601, L67 [NASA ADS] [CrossRef] [Google Scholar]
- Becker, R., Henkel, C., Wilson, T. L., & Wouterloot, J. G. A. 1993, A&A, 268, 483 [NASA ADS] [Google Scholar]
- Braatz, J. A., & Gugliucci, N. E. 2008, ApJ, 678, 96 [NASA ADS] [CrossRef] [Google Scholar]
- Braatz, J. A., Henkel, C., Greenhill, L. J., Moran, J. M., & Wilson, A. S. 2004, ApJ, 617, L29 [NASA ADS] [CrossRef] [Google Scholar]
- Brunthaler, A., Henkel, C., de Blok, W. J. G., et al. 2006, A&A, 457, 109 [NASA ADS] [CrossRef] [EDP Sciences] [Google Scholar]
- Brunthaler, A., Castangia, P., Tarchi, A., et al. 2009, A&A, 497, 103 [NASA ADS] [CrossRef] [EDP Sciences] [Google Scholar]
- Cappi, M., Palumbo, G. G. C., Pellegrini, S., & Persic, M. 1999, Astron. Nachr., 320, 248 [NASA ADS] [CrossRef] [Google Scholar]
- Carral, P., Turner, J. L., & Ho, P. T. P. 1990, ApJ, 362, 434 [NASA ADS] [CrossRef] [Google Scholar]
- Casoli, F., Combes, F., Augarde, R., Figon, P., & Martin, J. M. 1989, A&A, 224, 31 [NASA ADS] [Google Scholar]
- Casoli, F., Willaime, M.-C., Viallefond, F., & Gerin, M. 1999, A&A, 346, 663 [NASA ADS] [Google Scholar]
- Castangia, P., Tarchi, A., Henkel, C., & Menten, K. M. 2008, A&A, 479, 111 [NASA ADS] [CrossRef] [EDP Sciences] [Google Scholar]
- Churchwell, E., Witzel, A., Huchtmeier, W., et al. 1977, A&A, 54, 969 [NASA ADS] [Google Scholar]
- Collinge, M. J., Brandt, W. N., Kaspi, S., et al. 2001, ApJ, 557, 2 [NASA ADS] [CrossRef] [Google Scholar]
- Combes, F. 2001, Astrophys. Space Sci. Suppl., 277, 29 [Google Scholar]
- Darling, J., Brogan, C., & Johnson, K. 2008, ApJ, 685, L39 [NASA ADS] [CrossRef] [Google Scholar]
- della Ceca, R., Griffiths, R. E., Heckman, T. M., Lehnert, M. D., & Weaver, K. A. 1999, ApJ, 514, 772 [NASA ADS] [CrossRef] [Google Scholar]
- della Ceca, R., Ballo, L., Tavecchio, F., et al. 2002, ApJ, 581, L9 [NASA ADS] [CrossRef] [Google Scholar]
- Foschini, L., Rodriguez, J., Fuchs, Y., et al. 2004, A&A, 416, 529 [NASA ADS] [CrossRef] [EDP Sciences] [Google Scholar]
- Fukazawa, Y., Iyomoto, N., Kubota, A., Matsumoto, Y., & Makishima, K. 2001, A&A, 374, 73 [NASA ADS] [CrossRef] [EDP Sciences] [Google Scholar]
- Gallais, P., Charmandaris, V., Le Floc’h, E., et al. 2004, A&A, 414, 845 [NASA ADS] [CrossRef] [EDP Sciences] [Google Scholar]
- Gao, Y., & Solomon, P. M. 2004, ApJS, 152, 63 [NASA ADS] [CrossRef] [Google Scholar]
- García-Marín, M., Colina, L., Arribas, S., Alonso-Herrero, A., & Mediavilla, E. 2006, ApJ, 650, 850 [NASA ADS] [CrossRef] [Google Scholar]
- George, I. M., Turner, T. J., Netzer, H., et al. 1998, ApJS, 114, 73 [NASA ADS] [CrossRef] [Google Scholar]
- Greene, J. E., Peng, C. Y., Kim, M., et al. 2010, ApJ, 721, 26 [NASA ADS] [CrossRef] [Google Scholar]
- Greenhill, L. J., Kondratko, P. T., Lovell, J. E. J., et al. 2003, ApJ, 582, L11 [NASA ADS] [CrossRef] [Google Scholar]
- Greenhill, L. J., Tilak, A., & Madejski, G. 2008, ApJ, 686, L13 [NASA ADS] [CrossRef] [Google Scholar]
- Guainazzi, M., Matt, G., Fiore, F., & Perola, G. C. 2002, A&A, 388, 787 [NASA ADS] [CrossRef] [EDP Sciences] [Google Scholar]
- Guainazzi, M., Fabian, A. C., Iwasawa, K., Matt, G., & Fiore, F. 2005, MNRAS, 356, 295 [NASA ADS] [CrossRef] [Google Scholar]
- Hagiwara, Y. 2007, AJ, 133, 1176 [NASA ADS] [CrossRef] [Google Scholar]
- Hagiwara, Y., Diamond, P. J., Nakai, N., & Kawabe, R. 2001a, ApJ, 560, 119 [NASA ADS] [CrossRef] [Google Scholar]
- Hagiwara, Y., Henkel, C., Menten, K. M., & Nakai, N. 2001b, ApJ, 560, L37 [NASA ADS] [CrossRef] [Google Scholar]
- Hagiwara, Y., Diamond, P. J., Miyoshi, M., Rovilos, E., & Baan, W. 2003, MNRAS, 344, L53 [NASA ADS] [CrossRef] [Google Scholar]
- Henkel, C., & Wilson, T. L. 1990, A&A, 229, 431 [NASA ADS] [Google Scholar]
- Henkel, C., Tarchi, A., Menten, K. M., & Peck, A. B. 2004, A&A, 414, 117 [NASA ADS] [CrossRef] [EDP Sciences] [Google Scholar]
- Henkel, C., Peck, A. B., Tarchi, A., et al. 2005, A&A, 436, 75 (HPT) [NASA ADS] [CrossRef] [EDP Sciences] [Google Scholar]
- Henriksen, M., & Cousineau, S. 1999, ApJ, 511, 595 [NASA ADS] [CrossRef] [Google Scholar]
- Hofner, P., Baan, W. A., & Takano, S. 2006, AJ, 131, 2074 [NASA ADS] [CrossRef] [Google Scholar]
- Högbom, J. A. 1974, A&AS, 15, 417 [Google Scholar]
- Huchtmeier, W. K., Witzel, A., Kuehr, H., Pauliny-Toth, I. I., & Roland, J. 1978, A&A, 64, L21 [NASA ADS] [Google Scholar]
- Huchtmeier, W. K., Richter, O., Witzel, A., & Pauliny-Toth, I. 1980, A&A, 91, 259 [NASA ADS] [Google Scholar]
- Irwin, J. A., English, J., & Sorathia, B. 1999, AJ, 117, 2102 [NASA ADS] [CrossRef] [Google Scholar]
- Irwin, J. A., Saikia, D. J., & English, J. 2000, AJ, 119, 1592 (ISE) [NASA ADS] [CrossRef] [Google Scholar]
- Jenkins, L. P., Roberts, T. P., Ward, M. J., & Zezas, A. 2004, MNRAS, 352, 1335 [NASA ADS] [CrossRef] [Google Scholar]
- King, D., & Irwin, J. A. 1997, New Astron., 2, 251 [NASA ADS] [CrossRef] [Google Scholar]
- Klöckner, H. R., & Baan, W. A. 2002, in Cosmic Masers: From Proto-Stars to Black Holes, ed. V. Migenes, & M. J. Reid, IAU Symp., 206, 430 [Google Scholar]
- Kondratko, P. T., Greenhill, L. J., Moran, J. M., et al. 2006, ApJ, 638, 100 [NASA ADS] [CrossRef] [Google Scholar]
- Kong, A. K. H. 2003, MNRAS, 346, 265 [NASA ADS] [CrossRef] [Google Scholar]
- Kubota, A., Done, C., & Makishima, K. 2002, MNRAS, 337, L11 [NASA ADS] [CrossRef] [Google Scholar]
- Leighly, K. M., Halpern, J. P., Awaki, H., et al. 1999, ApJ, 522, 209 [NASA ADS] [CrossRef] [Google Scholar]
- Lira, P., Ward, M., Zezas, A., Alonso-Herrero, A., & Ueno, S. 2002, MNRAS, 330, 259 [NASA ADS] [CrossRef] [Google Scholar]
- Lonsdale, C. J., Lonsdale, C. J., & Smith, H. E. 1992, ApJ, 391, 629 [NASA ADS] [CrossRef] [Google Scholar]
- Maiolino, R., Salvati, M., Bassani, L., et al. 1998, A&A, 338, 781 [NASA ADS] [Google Scholar]
- Martin, J. 1989, Ph.D. Thesis, Université de Paris [Google Scholar]
- Matsumoto, C., Nava, A., Maddox, L. A., et al. 2004, ApJ, 617, 930 [NASA ADS] [CrossRef] [Google Scholar]
- Méndez, D. I., Esteban, C., Filipović, M. D., et al. 1999, A&A, 349, 801 [NASA ADS] [Google Scholar]
- Mundell, C. G., Wrobel, J. M., Pedlar, A., & Gallimore, J. F. 2003, ApJ, 583, 192 [NASA ADS] [CrossRef] [Google Scholar]
- Nakagawa, T., Nagata, T., Geballe, T. R., et al. 1989, ApJ, 340, 729 [NASA ADS] [CrossRef] [Google Scholar]
- Neff, S. G., & Ulvestad, J. S. 2000, AJ, 120, 670 [NASA ADS] [CrossRef] [Google Scholar]
- Neff, S. G., Ulvestad, J. S., & Teng, S. H. 2004, ApJ, 611, 186 [NASA ADS] [CrossRef] [Google Scholar]
- Osterbrock, D. E., & Koski, A. T. 1976, MNRAS, 176, 61P [NASA ADS] [CrossRef] [Google Scholar]
- Ott, J., Walter, F., & Brinks, E. 2005, MNRAS, 358, 1423 [NASA ADS] [CrossRef] [Google Scholar]
- Pérez-Torres, M. A., Romero-Cañizales, C., Alberdi, A., & Polatidis, A. 2009, A&A, 507, L17 [NASA ADS] [CrossRef] [EDP Sciences] [Google Scholar]
- Polatidis, A. G., & Aalto, S. 2000, in EVN Symp. 2000, Proc. the 5th european VLBI Network Symp., ed. J. E. Conway, A. G. Polatidis, R. S. Booth, & Y. M. Pihlström, 127 [Google Scholar]
- Polatidis, A. G., & Aalto, S. 2001, in IAU Symp., ed. R. T. Schilizzi, 198 [Google Scholar]
- Pounds, K. A., Reeves, J. N., King, A. R., & Page, K. L. 2004, MNRAS, 350, 10 [NASA ADS] [CrossRef] [Google Scholar]
- Read, A. M. 2005, MNRAS, 359, 455 [NASA ADS] [CrossRef] [Google Scholar]
- Sanders, D. B., Mazzarella, J. M., Kim, D., Surace, J. A., & Soifer, B. T. 2003, AJ, 126, 1607 [Google Scholar]
- Sargent, A., & Scoville, N. 1991, ApJ, 366, L1 [NASA ADS] [CrossRef] [Google Scholar]
- Schulz, A., Henkel, C., Muders, D., et al. 2007, A&A, 466, 467 [NASA ADS] [CrossRef] [EDP Sciences] [Google Scholar]
- Schurch, N. J., & Warwick, R. S. 2002, MNRAS, 334, 811 [NASA ADS] [CrossRef] [Google Scholar]
- Sergeev, S. G., Pronik, V. I., & Sergeeva, E. A. 2001, ApJ, 554, 245 [NASA ADS] [CrossRef] [Google Scholar]
- Stevens, I. R., Read, A. M., & Bravo-Guerrero, J. 2003, MNRAS, 343, L47 [NASA ADS] [CrossRef] [Google Scholar]
- Strickland, D. K., Heckman, T. M., Colbert, E. J. M., Hoopes, C. G., & Weaver, K. A. 2004, ApJS, 151, 193 [NASA ADS] [CrossRef] [Google Scholar]
- Surcis, G., Tarchi, A., Henkel, C., et al. 2009, A&A, 502, 529 [NASA ADS] [CrossRef] [EDP Sciences] [Google Scholar]
- Takano, M., Mitsuda, K., Fukazawa, Y., & Nagase, F. 1994, ApJ, 436, L47 [NASA ADS] [CrossRef] [Google Scholar]
- Tarchi, A., Henkel, C., Peck, A. B., & Menten, K. M. 2002a, A&A, 389, L39 [NASA ADS] [CrossRef] [EDP Sciences] [Google Scholar]
- Tarchi, A., Henkel, C., Peck, A. B., & Menten, K. M. 2002b, A&A, 385, 1049 [NASA ADS] [CrossRef] [EDP Sciences] [Google Scholar]
- Tarchi, A., Brunthaler, A., Henkel, C., et al. 2007a, A&A [Google Scholar]
- Tarchi, A., Castangia, P., Henkel, C., & Menten, K. M. 2007b, New Astron. Rev. [Google Scholar]
- Telesco, C. M., Decher, R., & Gatley, I. 1985, ApJ, 299, 896 [NASA ADS] [CrossRef] [Google Scholar]
- Terashima, Y., Ptak, A., Fujimoto, R., et al. 1998, ApJ, 496, 210 [NASA ADS] [CrossRef] [Google Scholar]
- Ulvestad, J. S. 2009, AJ, 138, 1529 [NASA ADS] [CrossRef] [Google Scholar]
- Ulvestad, J. S., Wong, D. S., Taylor, G. B., Gallimore, J. F., & Mundell, C. G. 2005, AJ, 130, 936 [NASA ADS] [CrossRef] [Google Scholar]
- Wang, Q. D., Chaves, T., & Irwin, J. A. 2003a, ApJ, 598, 969 [NASA ADS] [CrossRef] [Google Scholar]
- Wang, Q. D., Chaves, T., & Irwin, J. A. 2003b, ApJ, 598, 969 [NASA ADS] [CrossRef] [Google Scholar]
- Weaver, K. A., Heckman, T. M., Strickland, D. K., & Dahlem, M. 2002, ApJ, 576, L19 [NASA ADS] [CrossRef] [Google Scholar]
- Wilson, A. S., & Ulvestad, J. S. 1982, ApJ, 263, 576 [NASA ADS] [CrossRef] [Google Scholar]
- Zezas, A., Fabbiano, G., Rots, A. H., & Murray, S. S. 2002, ApJ, 577, 710 [NASA ADS] [CrossRef] [Google Scholar]
- Zezas, A., Ward, M. J., & Murray, S. S. 2003, ApJ, 594, L31 [NASA ADS] [CrossRef] [Google Scholar]
- Zhang, J. S., Henkel, C., Kadler, M., et al. 2006, A&A, 450, 933 [NASA ADS] [CrossRef] [EDP Sciences] [Google Scholar]
All Tables
Properties of extragalactic 22 GHz H2O kilomasers and their potential association with AGN, SNR, or Hiiregions.
Nuclear X-ray absorbing column densities of extragalactic H2O kilomaser galaxies*. This table is an updated version of that presented by Zhang et al. (2006).
All galaxies known so far to host either H2O(standard font) or OH (italics) maser emission, or both (bold face).
All Figures
|
Fig. 1 The VLA CnB-array (blue solid line) and DnA-array (black solid line) water maser spectra of NGC 3556 taken in 2002 and 2006, respectively. Both spectra have a channel spacing of 0.7 km s-1. |
| In the text | |
|
Fig. 2 Channel maps of the H2O maser emission in NGC 3556 observed with the VLA CnB array. Contour levels are –3, 3, 3.5, 4 × 4 mJy beam-1 (1σ rms = 4 mJy beam-1). The cross indicates the position of the line peak. |
| In the text | |
|
Fig. 3 Gray scale and contour plot of the total integrated intensity of the maser emission in NGC 3556 observed with the VLA DnA array. Integration was performed over the velocity interval 720–760 km s-1. Contours: –1, 1, 2, 4 × 25 mJy/beam/km s-1. (1σ rms = 0.4 mJy/beam/km s-1). |
| In the text | |
|
Fig. 4 Big panel: moment-zero map (gray scale) of the water maser emission in the Arp299 system observed by the VLA in its D configuration superimposed on the 22-GHz uniformly-weighted VLA D-array radio continuum image (contours) of the system produced by using the line-free channels in the maser data cube. Contour levels are –1, 1, 2, 4, 8, 16, 32, 64 × 0.5 mJy beam-1 (1σ rms = 0.15 mJy beam-1). Small panels: for each center of maser emission within the Arp299 system, spectra from Effelsberg (dashed line), VLA D-array (solid line), and VLA A-array (dash-dotted line) are shown, with a channel spacing of 17, 20, and 20 km s-1, respectively. |
| In the text | |
|
Fig. 5 Weak water maser feature detected in the Arp299 system observed by the VLA in its D configuration at the position of the western peak of the C + C’-complex, labeled C (Neff et al. 2004, Fig. 4). The channel spacing is 20 km s-1. |
| In the text | |
|
Fig. 6 Lower-left panel: naturally-weighted VLA DnA-array 22 GHz radio continuum contour map of NGC 4151 produced by using the line-free channels in the maser data cube. Contours: –1, 1, 2, 3, 4, 5 × 1.7 mJy (1σ rms = 0.6 mJy beam-1). Upper panels: 22 GHz spectra from the IF1 (left) and IF2 (right) VLA DnA-array data cube. The two IFs sample the velocity ranges where narrow water maser lines (their velocities are marked by arrows) were detected with the GBT by Braatz et al. (2004). The systemic velocity of the galaxy is 995 km s-1. |
| In the text | |
|
Fig. 7 Lower large panel: a VLA A-array map of the continuum emission of NGC 3556 at 20 cm (ISE). The asterisk identifies the optical center. The large black cross indicates the Hikinematic center given by King & Irwin (1997) with the relative error (dashed-line circle). The smaller blue cross near the upper right corner of the green dashed circle denotes the 2 μm peak. The pink triangle marks the position of Chandra source 35. The position of the water maser is indicated by the red X-mark. The multipointed star in the lower right edge indicates a position where some supernovae have been detected (see ISE). Upper left panel: naturally weighted contour image of the only compact nuclear radio continuum source, among those of ISE, detected in NGC 3556 at 1.4 GHz by MERLIN. Contours: –2.5, 2.5, 3, 3.5, 4, 4.5, 5 × 50 μJy/beam (1σ rms = 0.05 mJy beam-1). Upper right panel: uniformly-weighted 1.4 GHz MERLIN contour image of the compact source. The star marks the water maser position. Contours: –3, 3, 3.5, 4 × 40 μJy/beam (1σ rms = 0.04 mJy beam-1). |
| In the text | |
|
Fig. 8 A modified version of Fig. 11 of BH90 showing the Hi and OH velocity components along the major axis (at position angle of ~45°) near the nucleus of IC 694. The red “X” marks the position and velocity the water maser feature detected by us in IC 694. |
| In the text | |
|
Fig. 9 Water maser spectra taken with the 100-m Effelsberg telescope on Nov. 2005, pointing towards putative nuclei of IC 694 (dash-dotted line) and NGC 3690 (dashed line), and on April 5, 2007 (4 days before the VLA D-array measurements) on a single pointing at intermediate distance between the nuclei (solid line). In this case, the Effelsberg 40″ beam covers the entire Arp 299 system. |
| In the text | |
|
Fig. 10 Histogram showing the number of H2O kilomaser galaxies as a function of their nuclear column density derived from X-ray spectroscopy. Due to the higher angular resolution, Chandra data are taken whenever possible (with the exception of NGC 4051 for which the XMM-derived column density value was preferred to that of Chandra because of the large uncertainties reported). Otherwise, the most recent measurements are used (see Table 4). The arrows for NGC 2273 and NGC 6300 indicate lower limits to the column densities. Each color indicates the association of the water maser emission with either star formation or AGN activity, and the degree of confidence in such an association. |
| In the text | |
|
Fig. 11 OH vs. H2O maser luminosity including all sources where masers from both species have been searched for. Green arrows represent the galaxies hosting only H2O maser emission, red arrows are those sources hosting only OH maser emission, and filled triangles are galaxies where both H2O and OH masers have been detected. Upper limits for the undetected maser species are set to the detection luminosity threshold (3σ) of the survey in that maser transition. The dashed lines indicate the separation between kilomaser and megamaser regimes as found in the literature (for H2O masers, see Sect. 1; for OH masers, see Henkel & Wilson 1990). The question mark associated with the position in the plot of UGC 5101 is explained in Sect. 4.3. |
| In the text | |
Current usage metrics show cumulative count of Article Views (full-text article views including HTML views, PDF and ePub downloads, according to the available data) and Abstracts Views on Vision4Press platform.
Data correspond to usage on the plateform after 2015. The current usage metrics is available 48-96 hours after online publication and is updated daily on week days.
Initial download of the metrics may take a while.