Free Access
Fig. 2
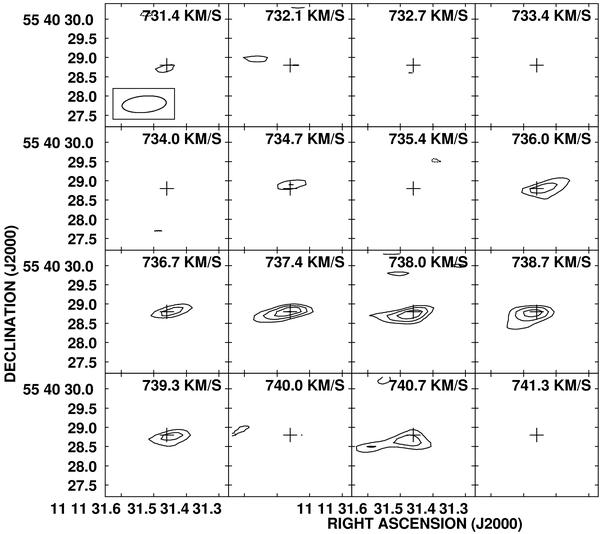
Channel maps of the H2O maser emission in NGC 3556 observed with the VLA CnB array. Contour levels are –3, 3, 3.5, 4 × 4 mJy beam-1 (1σ rms = 4 mJy beam-1). The cross indicates the position of the line peak.
Current usage metrics show cumulative count of Article Views (full-text article views including HTML views, PDF and ePub downloads, according to the available data) and Abstracts Views on Vision4Press platform.
Data correspond to usage on the plateform after 2015. The current usage metrics is available 48-96 hours after online publication and is updated daily on week days.
Initial download of the metrics may take a while.