Fig. 7
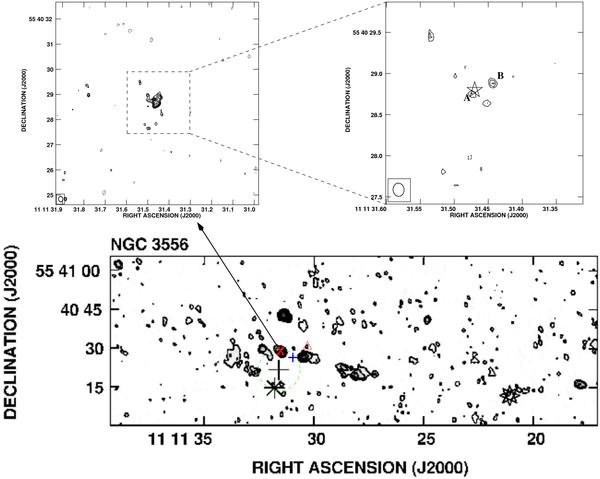
Lower large panel: a VLA A-array map of the continuum emission of NGC 3556 at 20 cm (ISE). The asterisk identifies the optical center. The large black cross indicates the Hikinematic center given by King & Irwin (1997) with the relative error (dashed-line circle). The smaller blue cross near the upper right corner of the green dashed circle denotes the 2 μm peak. The pink triangle marks the position of Chandra source 35. The position of the water maser is indicated by the red X-mark. The multipointed star in the lower right edge indicates a position where some supernovae have been detected (see ISE). Upper left panel: naturally weighted contour image of the only compact nuclear radio continuum source, among those of ISE, detected in NGC 3556 at 1.4 GHz by MERLIN. Contours: –2.5, 2.5, 3, 3.5, 4, 4.5, 5 × 50 μJy/beam (1σ rms = 0.05 mJy beam-1). Upper right panel: uniformly-weighted 1.4 GHz MERLIN contour image of the compact source. The star marks the water maser position. Contours: –3, 3, 3.5, 4 × 40 μJy/beam (1σ rms = 0.04 mJy beam-1).
Current usage metrics show cumulative count of Article Views (full-text article views including HTML views, PDF and ePub downloads, according to the available data) and Abstracts Views on Vision4Press platform.
Data correspond to usage on the plateform after 2015. The current usage metrics is available 48-96 hours after online publication and is updated daily on week days.
Initial download of the metrics may take a while.