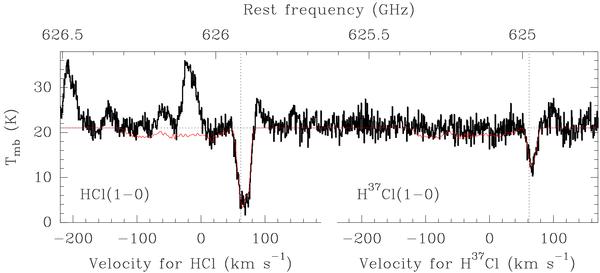
Fig. 8

Spectrum obtained toward Sgr B2(M) around 625 GHz with the APEX telescope in main beam brightness temperature. The red curve is the synthetic spectrum described in Sect. 4.1, the horizontal dotted line shows the continuum level, and the left and right vertical dotted lines mark the systemic velocity of the source (62 km s-1) for HCl and H37Cl, respectively. The strong emission close to the HCl line is likely due to a SO2 line at 626 087.3 MHz.
Current usage metrics show cumulative count of Article Views (full-text article views including HTML views, PDF and ePub downloads, according to the available data) and Abstracts Views on Vision4Press platform.
Data correspond to usage on the plateform after 2015. The current usage metrics is available 48-96 hours after online publication and is updated daily on week days.
Initial download of the metrics may take a while.


