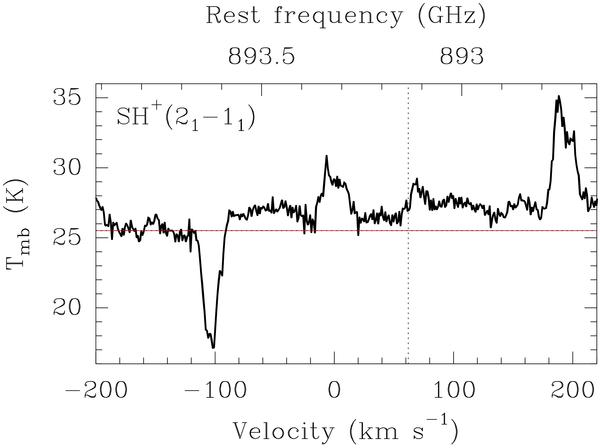
Fig. 7

Spectrum obtained toward Sgr B2(M) at the frequency of SH+ 21–11 with the APEX telescope in main beam brightness temperature. The red curve is the synthetic spectrum described in Sect. 4.1, i.e., showing no detectable emission, the horizontal dotted line shows the continuum level, and the vertical dotted line marks the systemic velocity of the source (62 km s-1). The absorption line appearing at ~− 105 km s-1 is the JKaKc = 111−000 ground-state line of HDO at 893 638.7 MHz (Comito et al. 2003).
Current usage metrics show cumulative count of Article Views (full-text article views including HTML views, PDF and ePub downloads, according to the available data) and Abstracts Views on Vision4Press platform.
Data correspond to usage on the plateform after 2015. The current usage metrics is available 48-96 hours after online publication and is updated daily on week days.
Initial download of the metrics may take a while.


