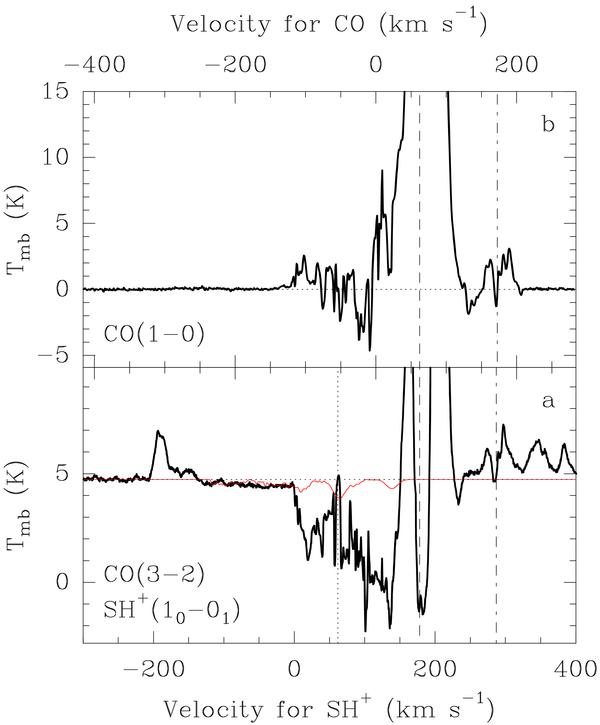
Fig. 6

a) Spectrum obtained toward Sgr B2(M) at the frequency of the SH+ 10–01 line with the APEX telescope in main beam brightness temperature. The red curve is the synthetic spectrum described in Sect. 4.1, the horizontal dotted line shows the continuum level, and the vertical dotted line marks the systemic velocity of the source (62 km s-1). The strong absorption lines are spiral arm components of CO 3–2. The lower axis gives the LSR velocity for SH+, while the upper axis refers to CO, with the same labeling as in panel b). b) CO(1–0) spectrum obtained toward Sgr B2 as part of our line survey with the IRAM 30 m telescope. The horizontal dotted line indicates the zero level (after baseline removal because the observations were performed in position-switching mode with a far OFF position, which yields a very uncertain baseline level). In both panels, the dashed line marks the systemic velocity of the source in CO 3–2 and the dot-dashed line indicates the CO velocity +172.6 km s-1 at which an extra absorption component appears in the 13CH+ spectrum (see discussion in Sect. 4.1.3.)
Current usage metrics show cumulative count of Article Views (full-text article views including HTML views, PDF and ePub downloads, according to the available data) and Abstracts Views on Vision4Press platform.
Data correspond to usage on the plateform after 2015. The current usage metrics is available 48-96 hours after online publication and is updated daily on week days.
Initial download of the metrics may take a while.


