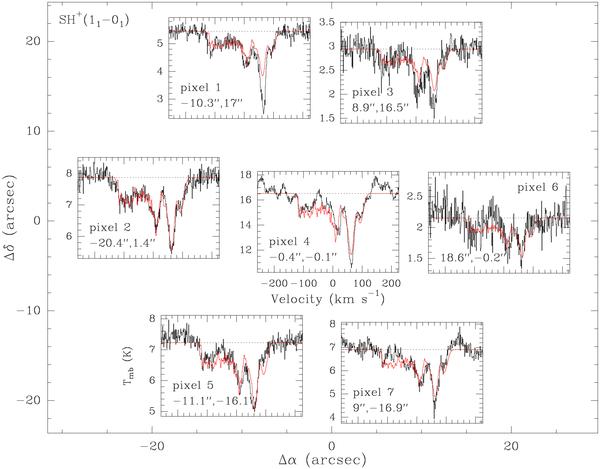
Fig. 5

SH+ absorption spectra obtained toward Sgr B2(M) with the 7-pixel array CHAMP+ at the APEX telescope. The equatorial offset position of each pixel relative to Sgr B2(M) is given in the bottom left corner of each panel. In each panel, the dotted line shows the continuum level as measured over the emission/absorption-free channels, and the red curve is the spectrum predicted by the Trot = TCMB model described in Sect. 4.1. All spectra are plotted in main-beam brightness temperature scale.
Current usage metrics show cumulative count of Article Views (full-text article views including HTML views, PDF and ePub downloads, according to the available data) and Abstracts Views on Vision4Press platform.
Data correspond to usage on the plateform after 2015. The current usage metrics is available 48-96 hours after online publication and is updated daily on week days.
Initial download of the metrics may take a while.


