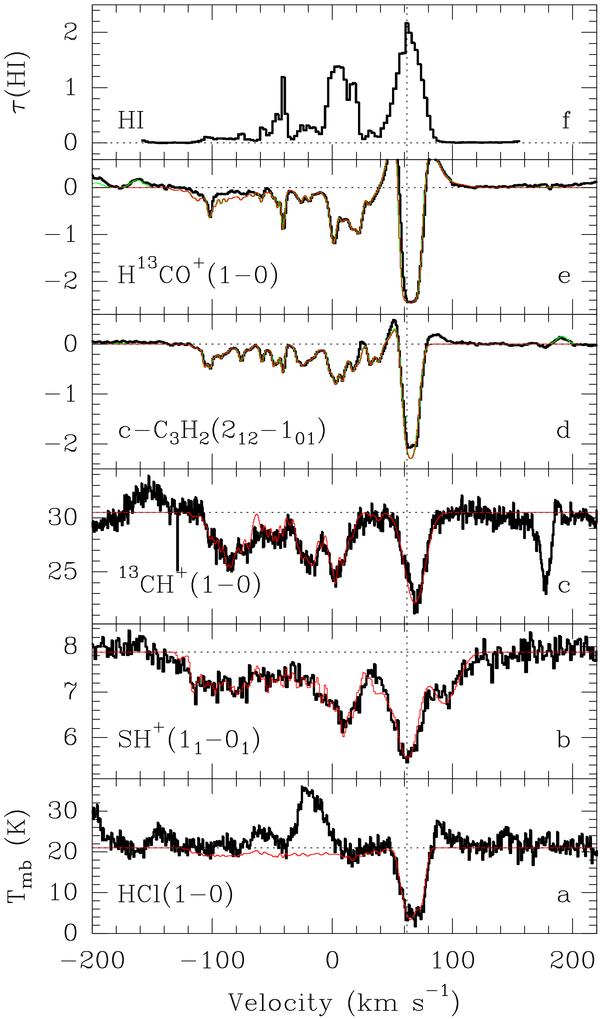
Fig. 2

From bottom to top, panels a) to c) show absorption spectra taken with the APEX telescope with the CHAMP+ receiver array. Spectra a) and b) were taken with the central pixel of CHAMP+ toward Sgr B2(M) (see Fig. 5). Spectrum b) was obtained toward a position (− 20.4″,1.4″) offset from Sgr B2(M) with the CHAMP+ pixel 2. a): H35Cl 1−0 absorption spectrum. b): SH+ 11–01 absorption spectrum. c): 13CH+ 1–0 absorption spectrum. In panels a)–c), the red curve is the synthetic spectrum described in Sect. 4.1 and the horizontal dotted line shows the continuum level. d) and e): same as b for the c-C3H2 212–101 and H13CO+ 1–0 transitions observed toward Sgr B2(M) with the IRAM 30 m telescope, respectively. Panel f) shows the optical depth of the 21 cm HI line vs. LSR velocity as derived by the procedure described in Sect. 5.1.2. In panels d) and e), the red curve is the synthetic spectrum of the molecule, the green curve is the predicted spectrum including in addition all molecules identified in our complete 3 mm line survey so far, and the horizontal dotted line indicates the zero level (after baseline removal because the observations were performed in position-switching mode with a far OFF position, which yields a very uncertain baseline level). In all panels, the spectra are plotted in main-beam brightness temperature scale, the vertical dotted line marks the systemic velocity of the source (62 km s-1).
Current usage metrics show cumulative count of Article Views (full-text article views including HTML views, PDF and ePub downloads, according to the available data) and Abstracts Views on Vision4Press platform.
Data correspond to usage on the plateform after 2015. The current usage metrics is available 48-96 hours after online publication and is updated daily on week days.
Initial download of the metrics may take a while.


